Basic Statistics and Math Concepts in Data Analytics | Tutorial
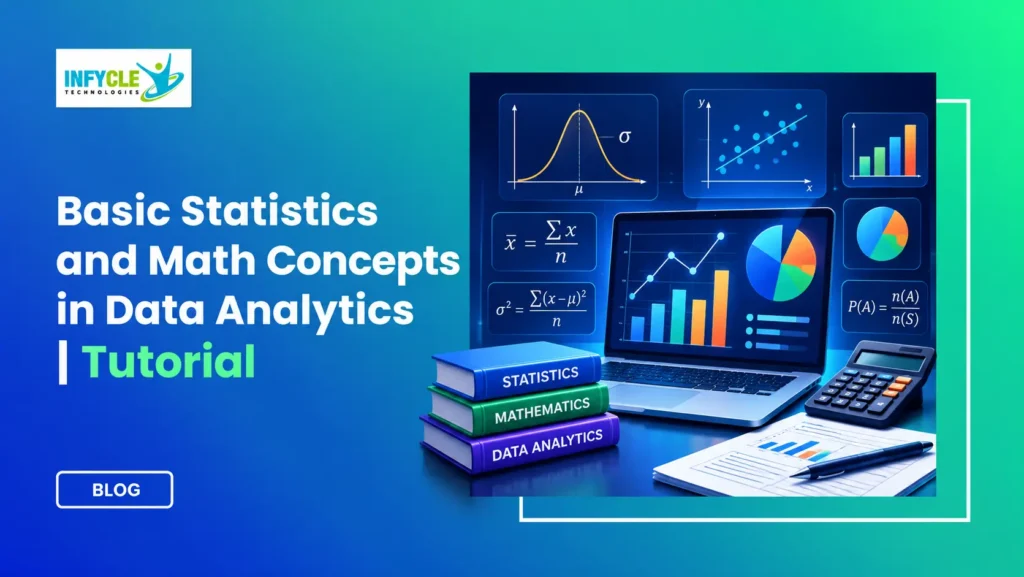
Data helps businesses make better decisions. However, numbers alone cannot explain customer behaviour, sales trends, or business performance. Understanding Math concepts in Data Analytics helps you turn raw numbers into useful insights.
Do you need advanced mathematics to become a data analyst? No. Most entry-level roles require basic statistics, percentages, probability, algebra, and logical thinking. Therefore, beginners from both technical and non-technical backgrounds can start learning with confidence.
For example, a retail company may want to understand why its monthly sales dropped. A data analyst can compare average sales, identify unusual values, and study customer purchase patterns. As a result, the company can make decisions based on evidence rather than assumptions.
Furthermore, tools such as Excel, SQL, Python, and Power BI make calculations easier. Still, knowing the mathematics behind those calculations helps you interpret results correctly.
This tutorial explains essential concepts through simple definitions, formulas, and practical examples. You’ll also learn how these skills support real business projects and data analytics career preparation.
Table of Contents
- What Are Math Concepts in Data Analytics?
- Why Is Basic Statistics Important?
- Essential Math Concepts in Data Analytics
- How Do Mean, Median, and Mode Work?
- How Do You Measure Data Variation?
- Probability and Math Concepts in Data Analytics
- What Is Correlation and Regression?
- How Are Math Concepts in Data Analytics Used in Projects?
- Which Tools Should Beginners Learn?
- Self-Learning vs Structured Training
- Frequently Asked Questions
- Conclusion
What Are Math Concepts in Data Analytics?
Math concepts in Data Analytics are mathematical methods that help analysts organise, measure, compare, and interpret information.
These methods help answer questions such as:
- What is the average monthly revenue?
- Which product performs best?
- How much do sales change each month?
- Is there a relationship between advertising and revenue?
- How likely is a customer to purchase again?
For example, imagine a company records daily website visits. Instead of examining thousands of individual numbers, an analyst calculates averages and identifies patterns.
Therefore, mathematics makes large datasets easier to understand.
You don’t need to master every mathematical topic immediately. Instead, begin with essential concepts and practise them using small datasets.
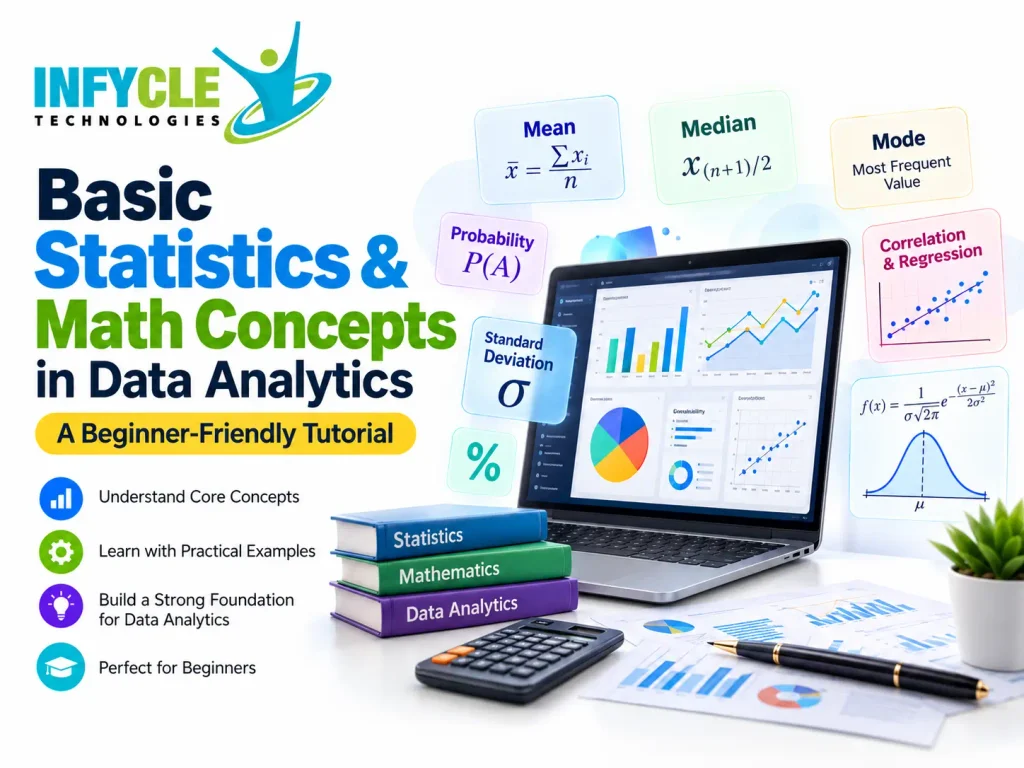
Why Is Basic Statistics Important in Data Analytics?
Basic statistics helps analysts summarise information, identify patterns, and make evidence-based decisions.
Statistics generally includes two main categories:
| Type | Meaning | Practical example |
|---|---|---|
| Descriptive statistics | Summarises existing data | Calculating average monthly sales |
| Inferential statistics | Draws conclusions about a larger group using sample data | Estimating customer satisfaction from a survey |
For instance, a business might survey 200 customers instead of contacting every customer. Inferential statistics helps the business estimate broader customer preferences.
Meanwhile, descriptive statistics helps the business understand the responses it collected.
Both methods play important roles in business reporting and decision-making.
Which Essential Math Concepts in Data Analytics Should Beginners Learn?
Beginners should focus on arithmetic, percentages, algebra, statistics, and probability before studying advanced mathematics.
Start with these five foundations.
| Concept | What you should learn | Business application |
|---|---|---|
| Arithmetic | Addition, subtraction, multiplication, division | Calculating revenue |
| Percentages | Growth, decline, proportions | Measuring conversion rates |
| Algebra | Variables and basic equations | Building calculation formulas |
| Statistics | Mean, median, mode, variation | Summarising customer data |
| Probability | Likelihood of events | Estimating customer behaviour |
How Are Percentages Used in Data Analytics?
Percentages help analysts compare changes, proportions, and performance across different periods.
For example, suppose a company’s sales increase from ₹40,000 to ₹50,000.
Percentage growth formula:
Percentage Growth = [(New Value − Old Value) / Old Value] × 100
= [(50,000 − 40,000) / 40,000] × 100
= 25%
Therefore, the company achieved 25% sales growth.
Analysts also use percentages to measure website conversion rates, customer retention, and marketing performance.
How Do Mean, Median, and Mode Work?
Mean, median, and mode describe the centre of a dataset in three different ways.
Consider the following student assessment scores:
40, 50, 60, 70, 80
| Measure | Definition | Result |
|---|---|---|
| Mean | Sum of values divided by their count | 60 |
| Median | Middle value after sorting | 60 |
| Mode | Most frequently occurring value | No mode |
What Is the Mean in Data Analytics?
The mean is the arithmetic average of all values in a dataset.
Formula:
Mean = Sum of All Values / Number of Values
Using our example:
Mean = (40 + 50 + 60 + 70 + 80) / 5
Mean = 60
For instance, analysts use the mean to calculate average revenue, employee performance, and customer spending.
However, extremely high or low values can affect the mean.
When Should You Use the Median?
Use the median when you want the middle value, especially when extreme values could distort the average.
Consider these monthly salaries:
₹15,000, ₹18,000, ₹20,000, ₹22,000, ₹1,50,000.
The median is ₹20,000. However, the mean is ₹45,000.
Therefore, the median better represents the typical salary in this example.
What Does Mode Tell a Data Analyst?
Mode identifies the value that appears most frequently in a dataset.
For example, consider these customer ratings:
4, 5, 4, 3, 4, 5, 2.
The mode is 4 because it appears three times.
As a result, businesses can identify common customer preferences, popular product sizes, or frequently selected services.
How Do You Measure Data Variation?
Data variation shows how widely values spread around a central point.
Two datasets may have the same mean but very different patterns. Therefore, analysts use variation measures to understand consistency and uncertainty.
What Are Range, Variance, and Standard Deviation?
Range measures the difference between the highest and lowest values. Variance measures the average squared distance from the mean. Standard deviation expresses that spread in the original units.
Consider this dataset:
10, 20, 30
The mean is 20.
| Measure | Calculation | Result |
|---|---|---|
| Range | 30 − 10 | 20 |
| Population variance | [(10−20)² + (20−20)² + (30−20)²] / 3 | 66.67 |
| Population standard deviation | √66.67 | Approximately 8.16 |
Note: These calculations use population formulas. Sample variance uses n − 1 as its denominator.
For example, a delivery company can measure variation in delivery times. A low standard deviation suggests more consistent performance.
In contrast, a high standard deviation indicates greater variation.
How Does Probability Connect With Math Concepts in Data Analytics?
Probability measures how likely an event is to happen, using values from 0 to 1.
A probability of 0 means an event cannot occur. Meanwhile, a probability of 1 means the event is certain.
Basic formula:
Probability = Favourable Outcomes / Total Equally Likely Outcomes
For example, imagine rolling a fair six-sided die.
The probability of getting a 4 is:
1 / 6 = 0.1667
Therefore, the probability is approximately 16.67%.
Where Do Analysts Use Probability?
Analysts use probability to assess uncertainty and estimate possible outcomes.
Common applications include:
- Estimating customer purchase likelihood.
- Evaluating financial risk.
- Understanding survey results.
- Supporting demand forecasts.
- Testing business assumptions.
However, a probability estimate does not guarantee an individual outcome.
What Is Correlation and Regression in Data Analytics?
Correlation measures the strength and direction of a relationship between two variables. Regression models relationships and can help estimate outcomes.
For example, a company may compare advertising spending with monthly sales.
What Does Correlation Measure?
Correlation shows whether two numerical variables tend to move together.
The Pearson correlation coefficient ranges from −1 to +1.
| Correlation value | General interpretation |
|---|---|
| +1 | Perfect positive linear relationship |
| 0 | No linear relationship |
| −1 | Perfect negative linear relationship |
For instance, advertising spending and sales may increase together.
However, correlation alone does not prove that one variable causes the other.
How Does Linear Regression Work?
Simple linear regression estimates a relationship between one input variable and one outcome variable.
Its basic equation is:
Y = a + bX
Here:
- Y = predicted outcome
- X = input variable
- a = intercept
- b = slope
For example, an analyst might build a model to estimate sales based on advertising expenditure.
Nevertheless, the analyst must check data quality and model assumptions before trusting predictions.
How Are Math Concepts in Data Analytics Used in Real Projects?
Math concepts in Data Analytics help professionals solve practical business problems using measurable evidence.
Consider three beginner-friendly projects.
Project 1: Retail Sales Analysis
First, collect sales records in Excel. Next, calculate average sales and monthly growth percentages. Finally, identify the highest-performing products.
Project 2: Customer Satisfaction Analysis
Calculate average ratings, identify the most common rating, and compare responses across customer groups. As a result, the business can prioritise areas for improvement.
Project 3: Marketing Campaign Analysis
Compare campaign spending, website traffic, and conversion rates. Furthermore, use charts to explain which campaigns performed well.
These projects help beginners connect mathematical concepts with workplace tasks.
Want to Practise Data Analytics With Real Projects?
Infycle Technologies offers career-focused learning for students, graduates, and professionals in Chennai.
Our Data Analytics training covers Excel, SQL, Power BI, Tableau, Python, and practical projects. In addition, learners can develop reporting, visualisation, and interview preparation skills.
Contact Infycle Technologies to enquire about the next batch and book a free demo class.
Which Tools Help Beginners Apply Math Concepts in Data Analytics?
Excel, SQL, Python, and Power BI help beginners apply mathematical and statistical concepts to real datasets.
Each tool supports different stages of the analytics process.
| Tool | Main purpose | Example |
|---|---|---|
| Excel | Calculations and basic analysis | AVERAGE, MEDIAN, STDEV.P |
| SQL | Querying and aggregating data | AVG(), COUNT(), SUM() |
| Python | Statistical analysis and automation | pandas and NumPy |
| Power BI | Data modelling and visualisation | Interactive sales dashboards |
| Tableau | Visual exploration | Comparing regional performance |
For example, Excel can calculate an average in seconds:
=AVERAGE(A2:A10)
Similarly, SQL can calculate average sales:
SELECT AVG(sales_amount) AS average_sales
FROM sales;
Therefore, understanding both the concept and the tool makes your analysis more reliable.
Is Self-Learning or Structured Training Better for Beginners?
Both methods can build analytics skills. However, structured training adds guidance, feedback, and an organised learning path.
| Factor | Self-Learning | Structured Training |
|---|---|---|
| Learning schedule | Flexible | Planned curriculum |
| Cost | Often lower | Course fee may apply |
| Mentor support | Depends on resources | Trainer guidance |
| Practical projects | Must find independently | May form part of training |
| Doubt clarification | Forums and tutorials | Direct learning support |
| Interview preparation | Self-managed | Guided preparation |
Self-learning works well for motivated beginners. Nevertheless, some learners benefit from regular practice and mentor feedback.
When comparing training providers, review their syllabus, trainer experience, project work, and placement assistance.
Frequently Asked Questions
1. Is advanced mathematics required to learn Data Analytics?
No. Beginners can start with arithmetic, percentages, averages, and basic statistics. Moreover, tools such as Excel and Python handle many calculations. Understanding the meaning behind each calculation matters more than memorising complex formulas when starting an entry-level analytics journey.
2. What are the most important Math concepts in Data Analytics?
The essential concepts include percentages, mean, median, mode, variance, standard deviation, probability, correlation, and regression. First, understand how each concept works. Then, practise with real datasets. These foundations support reporting, business analysis, data visualisation, and further statistical learning.
3. Can non-IT students learn Data Analytics?
Yes. Students from commerce, arts, science, and other backgrounds can learn Data Analytics. However, they should develop basic mathematical reasoning and computer skills. Starting with Excel, statistics, and SQL provides a useful foundation before moving into advanced analytics tools.
4. Which tool should beginners learn first for Data Analytics?
Excel is a practical starting point because it supports calculations, tables, charts, and data cleaning. Next, learn SQL for database queries. After that, explore Power BI and Python to build dashboards, automate analysis, and work with larger datasets.
5. How long does it take to learn basic statistics for Data Analytics?
Many beginners can understand essential statistical concepts within a few weeks of consistent study. However, practical confidence takes longer. Regular exercises involving averages, percentages, variation, and probability help learners apply concepts correctly instead of simply memorising definitions and formulas.
Conclusion: Why Should You Learn Statistics and Mathematics for Data Analytics?
Statistics and mathematics form the foundation of effective data analysis. They help you interpret numbers, identify trends, compare performance, and explain business results.
Start with arithmetic and percentages. Next, practise mean, median, mode, and variation. Then, explore probability, correlation, and regression through small projects.
Most importantly, combine your mathematical knowledge with practical tools and communication skills.
If you want a guided learning path, explore Data Analytics Training in Chennai at Infycle Technologies. Our practical learning approach helps beginners connect core concepts with analytics tools, projects, and career preparation.