Why Choose Infycle Technologies for Your Data Analytics Course in Chennai?
Data is shaping every industry, and businesses need professionals who can turn raw information into meaningful insights. If you’re looking for a Data Analytics Course in Chennai that combines practical learning with career-focused training, Infycle Technologies is the right place to begin. Our curriculum is regularly updated to match current industry practices, ensuring you learn the tools and techniques employers expect from today’s Data Analysts.
At Infycle Technologies, learning goes beyond the classroom. You’ll work on real-world datasets, industry case studies, and hands-on projects using tools like Excel, SQL, Python, Power BI, and Tableau. As a trusted Data Analytics Training Institute in Chennai, we also provide mentor support, interview preparation, and project guidance to help you build confidence for your career. Every session is designed to strengthen your analytical thinking and prepare you for opportunities in today’s data-driven industries.
Why Students Choose Infycle Technologies for Data Analytics Training in Chennai
Gain. Get Certified. Get Hired.
| May 1st | Mon-Fri(21 Days) | Timing 07:00 AM to 09:00 AM (IST) | Enroll Now |
| Jun 1st | Mon-Fri(21 Days) | Timing 07:00 AM to 09:00 AM (IST) | Enroll Now |
| Jul 1st | Mon-Fri(21 Days) | Timing 07:00 AM to 09:00 AM (IST) | Enroll Now |
Build a Strong Foundation in Data Analytics with Infycle Technologies
Benefits of Choosing Infycle Technologies for Your Data Analytics Course in Chennai
Choosing the right Data Analytics Course in Chennai is the first step toward building a successful career in data. At Infycle Technologies, you’ll gain practical skills through hands-on training, real-world projects, and expert guidance. As a trusted Data Analytics Training Institute in Chennai, we cover Excel, SQL, Python, Power BI, Data Visualization, and Business Intelligence to help you solve real business problems confidently.
Whether you’re a student, graduate, or working professional, our industry-focused training helps you build job-ready skills, strengthen your portfolio, and prepare for data analytics career opportunities with confidence.
Start Your Data Analytics Career with Infycle!
Join our Data Analytics Course in Chennai and gain practical skills, expert guidance, and placement support. Enquire today to secure your seat!
Why Learning Data Analytics Matters for Your Career
Data analytics helps businesses make smarter decisions by turning raw data into meaningful insights. Our Data Analytics Course in Chennai is designed to give you practical knowledge of industry-standard tools, real-world data analysis techniques, and problem-solving skills that employers value across industries.
- Learn Excel, SQL, Python, Power BI, and Tableau through hands-on practice.
- Work on real-world datasets and business case studies to build practical experience.
- Gain job-ready analytical and visualization skills with expert guidance from Infycle Technologies, a trusted Data Analytics Training Institute in Chennai.
Real Success Starts with the Right Training at Infycle Technologies
Enroll Today!
Join our Data Analytics Course in Chennai. Fill out the form to get course details, batch timings, and placement support.
Infycle Technologies – Start Your Data Analytics Journey
Build practical, job-ready skills with our Data Analytics Course in Chennai. Learn from experienced trainers through hands-on projects, industry-relevant tools, and dedicated placement support to confidently begin your data analytics career.
Why Choose Infycle Technologies for Data Analytics Training?
Build practical skills with a learning experience designed to prepare you for real career opportunities.
| Course Name | Data Analytics |
|---|---|
| Skill Level | Beginner, Intermediate, Advanced |
| Total Learners | 800+ |
| Course Duration | 500 Hours |
| Course Material |
|
| Student Portal | Yes |
| Placement Assistance | Yes |
Flexible Learning Schedule to Fit Your Routine
Choose a batch that matches your availability and learn at your own pace with Infycle Technologies.
Find the Right Direction for Your Data Analytics Career
Not sure which course is right for you? Let Infycle Technologies help you choose with confidence.

Learn Data Analytics from Industry Experts at Infycle Technologies
Gain practical skills, expert guidance, and the confidence to build a successful analytics career.
Earn a Recognized Data Analytics Certification
Validate your skills with industry-focused training and boost your confidence for high-paying analytics careers.

Frequently Asked Questions – Data Analytics Course in Chennai
Have questions? Our experts are here to help you make the right career decision.
Is the Data Analytics Course in Chennai suitable for beginners?
Yes. Our course starts with the fundamentals and gradually covers Excel, SQL, Python, Power BI, statistics, and data visualization, making it ideal for beginners, students, and working professionals.
What career opportunities can I get after completing this course?
You can apply for roles such as Data Analyst, Business Analyst, Reporting Analyst, BI Analyst, Data Visualization Specialist, and Junior Data Scientist across various industries.
Do I need a programming background to learn Data Analytics?
No. Basic computer knowledge is enough to begin. Our trainers teach every concept step by step with practical examples and hands-on projects.
Does Infycle Technologies provide placement assistance?
Yes. As a Data Analytics Training Institute in Chennai, we provide placement support, resume building, mock interviews, career guidance, and interview preparation to help you confidently apply for jobs.
Will I work on live projects during the training?
Absolutely. The Data Analytics Course in Chennai includes hands-on assignments, real-world case studies, and practical projects to build industry-ready skills.
Need More Clarification?
Our career advisors are ready to answer your questions and help you choose the right learning path. Contact Infycle Technologies today and book your free counseling session.
Let's get in touch
Give us a call or drop by anytime, we endeavour to answer all enquiries within 24 hours on business days.
Reviews
Some of the student's review about the training!

Jasmine Soundarya
Web Developer
Chris Jerry
Oracle Administrator
Vanmathi R
Cloud Practitioner
Santhana Kumar
Java Developer
Know more about Data Analytics
Scroll here to have a glance on precisely planned Data Analytics structure!
Course Syllabus
Structured Query Language (Oracle) • Excel • Python • Statistics • Power BI
Structured Query Language (Oracle)
1. Introduction to Database
- What is Data?
- What is Database?
- What is SQL?
- DBMS and RDBMS?
2. Retrieving Data
- Selecting Data
- Selecting Selective Number of Columns
- Arithmetic Calculation
- Renaming Column Heading (Alias)
- Combining Multiple Columns
- Handling NULLs
3. Restriction and Sorting
- Using WHERE Clause
- Relational Operator ( > < >= <= = <> )
- Oracle Operator (IN, BETWEEN..AND.., LIKE, IS NULL)
- Logical Operator ( AND OR NOT )
- ORDER BY (ASC | DESC)
4. Single Row Function
- Case Function
- Character Manipulation
- Number Function
- Date Function
- General Function
5. Multiple Row Function
- Aggregate Function / Group Function (MIN, MAX, SUM, AVG, COUNT)
- GROUP BY and HAVING Clause
6. CASE Expression
- Searched Case
7. Joins
- What is Join?
- Equi Join
- Outer Join (Right, Left, Full Join)
- Self-Join
- Cross Join / Cartesian Join
- Natural Join
- Non-Inner Join
- Practical Hands On
8. Sub Queries
- What is Sub Query?
- Single Row Sub Query
- Single Row Sub Query Operator
- Multiple Row Sub Query
- Multiple Row Sub Query Operator
- Correlated Sub Query
- Scalar Sub Query
- Inline View
- Multiple Column Sub Query
- IN & EXISTS Operator
- Practical Hands On
9. Data Query Language (DQL)
- SELECT
10. Data Define Language (DDL)
- Data Types
- CREATE
- ALTER
- RENAME
- DROP
- TRUNCATE
11. Data Manipulation Language (DML)
- INSERT
- UPDATE
- DELETE
- MERGE
- Simple Case
12. Data Control Language (DCL)
- GRANT
- REVOKE
13. Transaction Control Language (TCL)
- COMMIT
- ROLLBACK
- SAVEPOINT [ TO ]
14. Set Operators
- UNION
- UNION ALL
- INTERSECT
- MINUS
- Practical Hands On
15. Analytical Function
- What is Analytical Function?
- How it Differs from GROUP Function / Aggregate Function
- MIN( ) OVER( )
- MAX( ) OVER( )
- SUM( ) OVER( )
- AVG( ) OVER( )
- COUNT( ) OVER( )
- LEAD( ) OVER( )
- LAG( ) OVER( )
- FIRST_VALUE( ) OVER( )
- LAST_VALUE( ) OVER( )
- RANK( ) OVER( )
- DENSE_RANK( ) OVER( )
- LISTAGG( ) WITHIN GROUP( )
- PARTITION BY
- ORDER BY
- Windowing Clause
16. Common Table Expression (CTE)
17. Views
- What is View?
- Advantage of Creating View?
- Types of View
- WITH READ ONLY
- WITH CHECK OPTION
- DML Operation On View
Excel For Data Analytics
18. Understand the Excel Interface
19. Learn Basic Navigation and Data Entry
20. Excel Interface Overview
- Workbook vs. Worksheet
- Ribbon, Tabs, and Menus
- Cells, Rows, Columns
- Name Box and Formula Bar
21. Basic Navigation
- Moving Around the Worksheet
- Selecting Cells, Rows, and Columns
- Using the Go To Command
22. Data Entry and Basic Formatting
- Entering Text, Numbers, and Dates
- Editing Cell Contents
- Basic Formatting (Font, Size, Color, Cell Alignment)
23. Saving and Managing Workbooks
- Saving, Opening, and Closing Workbooks
- Save As Options (Different Formats)
24. Summary Functions
- SUM, AVERAGE, MIN, MAX, SUMIF, COUNTIF, AVERAGEIF, SUMIFS, COUNTIFS, AVERAGEIFS
- Using AutoSum
25. Cell Referencing
- Relative vs. Absolute References
- Mixed References
- Organize and Manage Data Efficiently
- Sorting and Filtering Data
- Sorting by One or Multiple Columns
- Applying Filters to Display Specific Data
- Using Filters Effectively
26. Using Tables
- Creating and Formatting Tables
- Table Styles and Features (Total Row, Header Row)
27. Data Validation
- Creating Drop-Down Lists
- Setting Data Entry Rules
- Conditional Formatting
- Using IFS Function, Greater Than, Lower Than, and Equal Between
- Using Colors
- Using Color Scales, Data Bars & Icon Sets
28. Use Advanced Formulas and Functions
- Logical Functions
- IF, AND, OR, NOT
- Lookup Functions
29. VLOOKUP
30. Text Functions
- CONCATENATE, LEFT, RIGHT, MID, LEN
31. Date and Time Functions
- TODAY, NOW, DATE, TIME, YEAR, MONTH, DAY, EOMONTH
32. Charts and Graphs
Python For Data Analytics
1. Python Fundamentals
- Introduction to Python
- Variables and Naming Conventions
- Data Types and Type Conversion
- Python Operators
- Data Structures
- Lists
- Tuples
- Sets
- Dictionaries
- Conditional Statements (if, elif, else)
- Looping Statements (for, while)
- Functions
- Built-in Functions
- User-Defined Functions
- Lambda Functions
- File Handling (Basics)
- Exception Handling (Basics)
- Hands-on Exercises
2. NumPy for Numerical Computing
- Introduction to NumPy
- Creating and Manipulating Arrays
- Array Indexing and Slicing
- Mathematical and Statistical Functions
- Array Operations
- String Operations in NumPy
- Reshaping and Broadcasting
- Practical Exercises
3. Pandas for Data Analysis
- Introduction to Pandas
- Series
- Data Frames
- Importing Data from CSV and Excel Files
- Data Selection and Filtering
- Sorting and Grouping Data
- Handling Missing Values
- Data Cleaning and Transformation
- Merging and Joining DataFrames
- Aggregation and Pivot Tables
- Hands-on Exercises
4. Data Visualization with Python
- Introduction to Data Visualization
- Matplotlib Fundamentals
- Seaborn Fundamentals
- Line Plot
- Bar Chart
- Scatter Plot
- Histogram
- Box Plot
- Count Plot
- Swarm Plot
- Cat Plot
- Pair Plot
- Heat Map
- Distribution Plot
- Visualization Best Practices
- Hands-on Exercises
Statistics for Data Analytics
1. Introduction to Statistics
- What is Statistics?
- Importance of Statistics in Data Analytics
- Types of Statistics
- Descriptive Statistics
- Inferential Statistics
2. Descriptive Statistics
- Measures of Central Tendency
- Mean
- Median
- Mode
- Measures of Dispersion
- Range
- Variance
- Standard Deviation
- Interquartile Range (IQR)
- Five-Number Summary
- Quartiles and Percentiles
- Skewness
- Kurtosis
- Box Plot
- Covariance
- Correlation
- Practical Exercises
3. Exploratory Data Analysis (EDA)
- Introduction to EDA
- Data Cleaning Techniques
- Handling Missing Values
- Outlier Detection and Treatment
- Feature Scaling
- Data Transformation
- Encoding Categorical Variables
- Data Visualization for EDA
- Practical Exercises
Power BI
1. Introduction to Power BI
- What is Power BI?
- Why Learn Power BI?
- Benefits of Power BI
- Power BI Architecture
- Power BI Building Blocks
- Key Components of Power BI
- Business Intelligence Concepts
2. Getting Started with Power BI Desktop
- Installation and Setup
- Power BI Desktop Overview
- Power BI Service
- Power BI Interface
- Important Tools and Terminologies
- Creating Your First Report
- Publishing Reports
- Sharing Reports and Dashboards
3. Connecting and Transforming Data
- Connecting to Data Sources
- Excel
- CSV
- SQL Database
- Import Mode vs Direct Query Mode
- Power Query Editor
- Data Cleaning Techniques
- Data Transformation
- Merge Queries
- Append Queries
- Data Profiling
4. Data Modeling
- Introduction to Data Modeling
- Creating Relationships
- Relationship Types and Cardinality
- Star Schema and Snowflake Schema
- Data Modeling Best Practices
- Calculated Columns
- Measures
- Data Categorization
- Data Summarization
5. DAX (Data Analysis Expressions)
- Introduction to DAX
- DAX Syntax and Rules
- DAX Data Types
- Operators in DAX
- Common DAX Functions
- Calculated Columns
- Measures
- Variables
- Filter Functions
- Time Intelligence Functions
- Writing DAX Queries
6. Data Visualization
- Creating Visualizations
- Tables and Matrix
- Bar and Column Charts
- Line and Area Charts
- Pie and Donut Charts
- Scatter Charts
- Maps
- KPI Visuals
- Cards
- Gauges
- Slicers
- Filters
- Drill Down and Drill Through
- Conditional Formatting
- Bookmarks and Navigation
7. Reports and Dashboards
- Designing Interactive Reports
- Report Formatting
- Managing Visual Interactions
- Applying Report-Level, Page-Level, and Visual-Level Filters
- Creating Dashboards
- Publishing to Power BI Service
- Exporting Reports to PDF and PowerPoint
- Sharing Dashboards
- Refreshing Data
- Best Practices for Dashboard Design
FAQ
How do I choose the best Data Analytics course in Chennai for my career goals?
When choosing a Data Analytics course in Chennai, look for a learning path that covers both analytical concepts and practical tools used to work with data. Important areas may include Excel, SQL, data cleaning, data analysis, data visualisation, dashboards, reporting, and business insights.
Also consider hands-on practice, assignments, project work, trainer guidance, and whether the course helps you understand how raw data can be transformed into meaningful insights. At Infycle Technologies, Data Analytics training focuses on structured learning and practical application.
What is the difference between Data Analytics, Data Science, and Business Analytics?
These fields are closely related but have different areas of focus.
Data Analytics focuses on examining and interpreting data to identify patterns, answer questions, and support decision-making.
Business Analytics applies data analysis to business problems, performance measurement, reporting, and decision-making.
Data Science is a broader field that can involve data collection, programming, statistics, predictive modelling, and Machine Learning.
In simple terms:
Data → Analysis → Insights → Decisions
A Data Analytics learning path is generally focused on understanding data, analysing it, creating reports or dashboards, and communicating useful insights.
What tools should I learn to become a Data Analyst?
The tools you learn can depend on the type of Data Analyst role you want to pursue. A strong foundation may include:
- Microsoft Excel for data handling and analysis
- SQL for working with databases
- Power BI or similar data visualisation tools for dashboards and reporting
- Data cleaning and data preparation
- Basic statistics and analytical thinking
- Data visualisation and business reporting
Depending on your career path, you may later add skills such as Python or other specialised analytics tools.
Why is SQL important for a Data Analyst?
SQL (Structured Query Language) is used to retrieve, filter, organise, and analyse data stored in relational databases. A Data Analyst may use SQL to work with datasets, combine information from different tables, perform calculations, and answer business-related questions.
For example, SQL can help analyse questions such as:
- Which products generated the highest sales?
- Which customers purchased most frequently?
- How has revenue changed over time?
Because organisations commonly store structured information in databases, SQL can be an important skill for learners building a Data Analytics career.
How are Excel, SQL, and Power BI used together in Data Analytics?
Excel, SQL, and Power BI can perform different but complementary roles in a Data Analytics workflow.
Excel can be used for organising, cleaning, analysing, and exploring data.
SQL can be used to retrieve and work with data stored in databases.
Power BI can be used to create visual reports and interactive dashboards.
A typical workflow may look like:
Data Sources → Data Cleaning → Analysis → SQL Queries → Visualisation → Dashboards → Business Insights
The exact workflow can vary depending on the organisation, available data, and business requirements.
What does a Data Analyst do in a real-world project?
A Data Analyst may work with raw or existing datasets to identify useful information and communicate findings clearly. Depending on the project, the process can involve:
Accessing Data → Cleaning Data → Exploring Patterns → Analysing Information → Creating Reports or Dashboards → Sharing Insights
For example, a business may want to understand sales performance, customer behaviour, operational trends, or campaign results. A Data Analyst can use analytical tools and techniques to examine the data and present findings that support decision-making.
Working on practical projects can help learners understand how individual Data Analytics skills connect within an end-to-end workflow.
Can freshers, non-IT students, and career switchers build a career in Data Analytics in Chennai?
Yes. Learners from different educational and professional backgrounds can begin learning Data Analytics by building the required concepts step by step. Beginners can start with areas such as data handling, Excel, analytical thinking, SQL, and data visualisation before progressing to more advanced tools and techniques.
A technical or computer science background can be useful for certain specialised roles, but it is not the only starting point for learning Data Analytics. Consistent practice, problem-solving, and working with practical datasets can help learners build confidence.
At Infycle Technologies, learners can develop their Data Analytics knowledge through structured learning and practical application based on their career goals.
What career paths can I explore after completing a Data Analytics course in Chennai?
Depending on your skills, practical projects, experience, and additional technologies, you may work towards roles such as:
Data Analyst · Junior Data Analyst · Business Analyst · Reporting Analyst · BI Analyst · Power BI Analyst
Different roles can require different skill combinations. For example, reporting and BI-focused roles may place greater emphasis on SQL, Power BI, dashboards, reporting, and data visualisation, while more advanced data-focused roles may require additional knowledge of Python, statistics, databases, or Machine Learning.
The strongest learning path is to combine relevant technical skills with practical projects that demonstrate your ability to analyse data, solve problems, and communicate meaningful insights.
Choose Infycle Technologies. Choose Success.
Master in-demand skills through hands-on training, real-time projects, and expert guidance to prepare for a successful IT career.
Join Infycle Technologies & Start Your Data Analytics Journey
Take the first step toward a rewarding analytics career. Book your FREE demo session and discover why our Data Analytics Course in Chennai helps students build real-world skills with expert guidance and placement support.
Data Analytics Course in Chennai
Build Job-Ready Data Analytics Skills with Infycle Technologies
At Infycle Technologies, our Data Analytics Course in Chennai helps students, graduates, and professionals gain practical skills through real-time projects and hands-on training. As a trusted Data Analytics Training Institute in Chennai, we focus on industry-relevant tools and business-oriented learning.
Course Highlights
- Data Analytics Fundamentals
- Advanced Excel
- SQL
- Python for Data Analytics
- Statistics & EDA
- Power BI & Dashboards
- Real-Time Projects
- Interview & Placement Support
Why Choose This Course?
Data analytics is one of the most in-demand career paths across industries. Our practical training helps you learn how to analyze data, create meaningful reports, and make data-driven decisions with confidence. At Infycle Technologies, you’ll gain the skills employers look for and be better prepared for interviews and real-world job opportunities.
Course Advantages
Discover how the right training at Infycle Technologies can help you build practical skills, boost your confidence, and prepare for a successful career in data analytics.
Advantages of Taking a Data Analytics Course in Chennai
The Data Analytics Course in Chennai at Infycle Technologies is designed to help you learn through practical experience, not just theory. Our curriculum focuses on the tools and techniques used by today’s data-driven organizations, ensuring you’re ready for real workplace challenges.
- Hands-on training with Excel, SQL, Python, and Power BI.
- Work on real-time projects and business case studies.
- Learn data cleaning, visualization, and reporting techniques.
- Build analytical thinking and problem-solving skills.
Why Choose Infycle Technologies for Data Analytics Training?
Choosing the right Data Analytics Training Institute in Chennai can make a significant difference in your career journey. At Infycle Technologies, experienced trainers, practical sessions, and career-focused guidance help you gain the confidence employers look for.
- Industry-relevant curriculum aligned with current job requirements.
- Interactive classroom and project-based learning.
- Interview preparation, resume building, and placement assistance.
- Flexible training schedules for students and working professionals.
Build Your Future with Confidence at Infycle Technologies
Your career deserves more than just a certificate—it deserves practical skills that open new opportunities. At Infycle Technologies, you’ll gain hands-on experience through real-world projects, expert guidance, and industry-focused training. If you want to expand your career beyond analytics, explore our Data Science Training in Chennai to build advanced skills in machine learning, artificial intelligence, and predictive analytics. Enroll today and take the next step toward a successful tech career.
Latest Blog
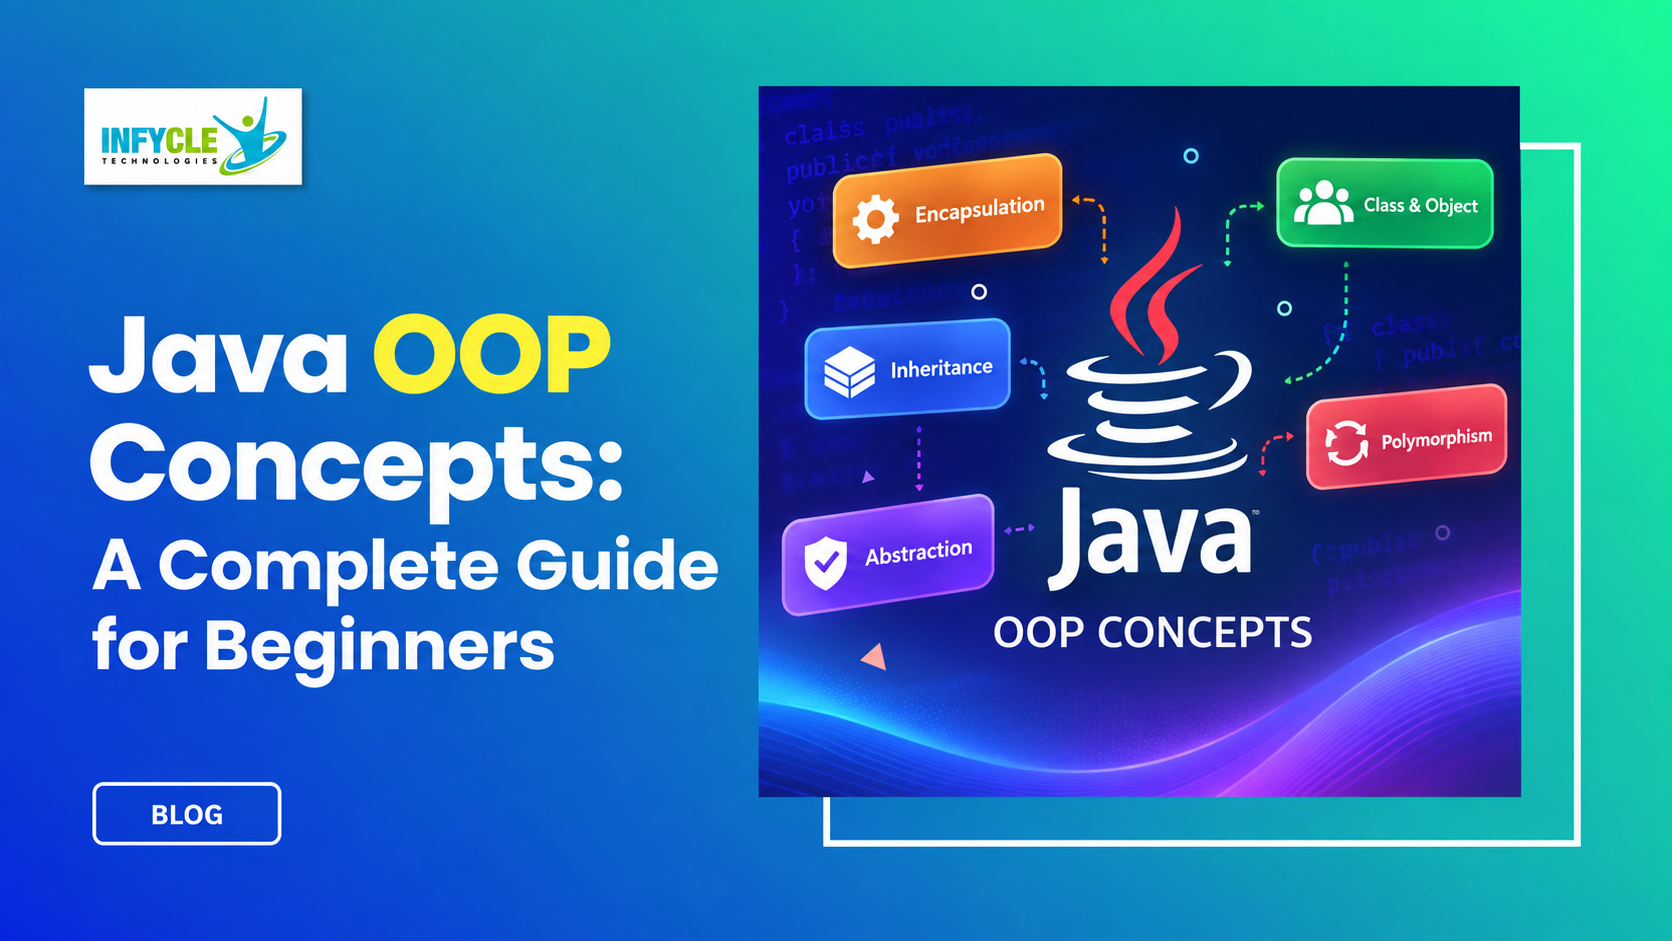
Introduction Learning Java OOP Concepts helps beginners understand how real Java applications are designed and built. Moreover, object-oriented programming makes complex code easier to organize, reuse, test, […]
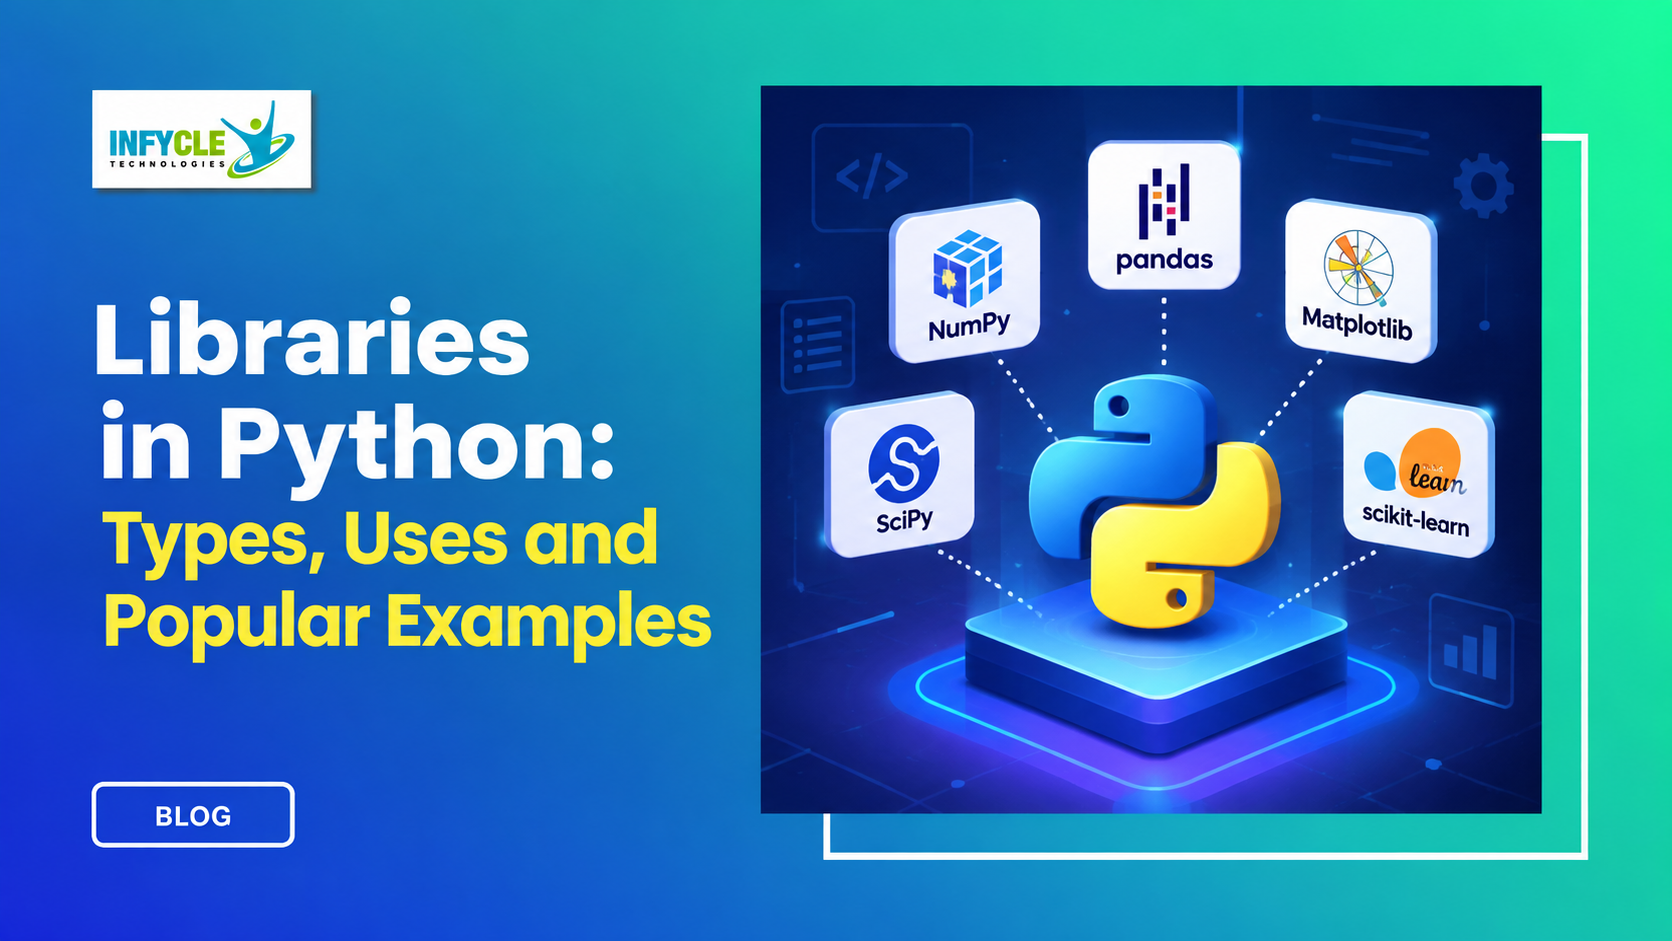
Introduction Libraries in Python help developers add powerful features without writing every function from scratch. Moreover, they make programming faster by providing ready-to-use tools for data analysis, […]
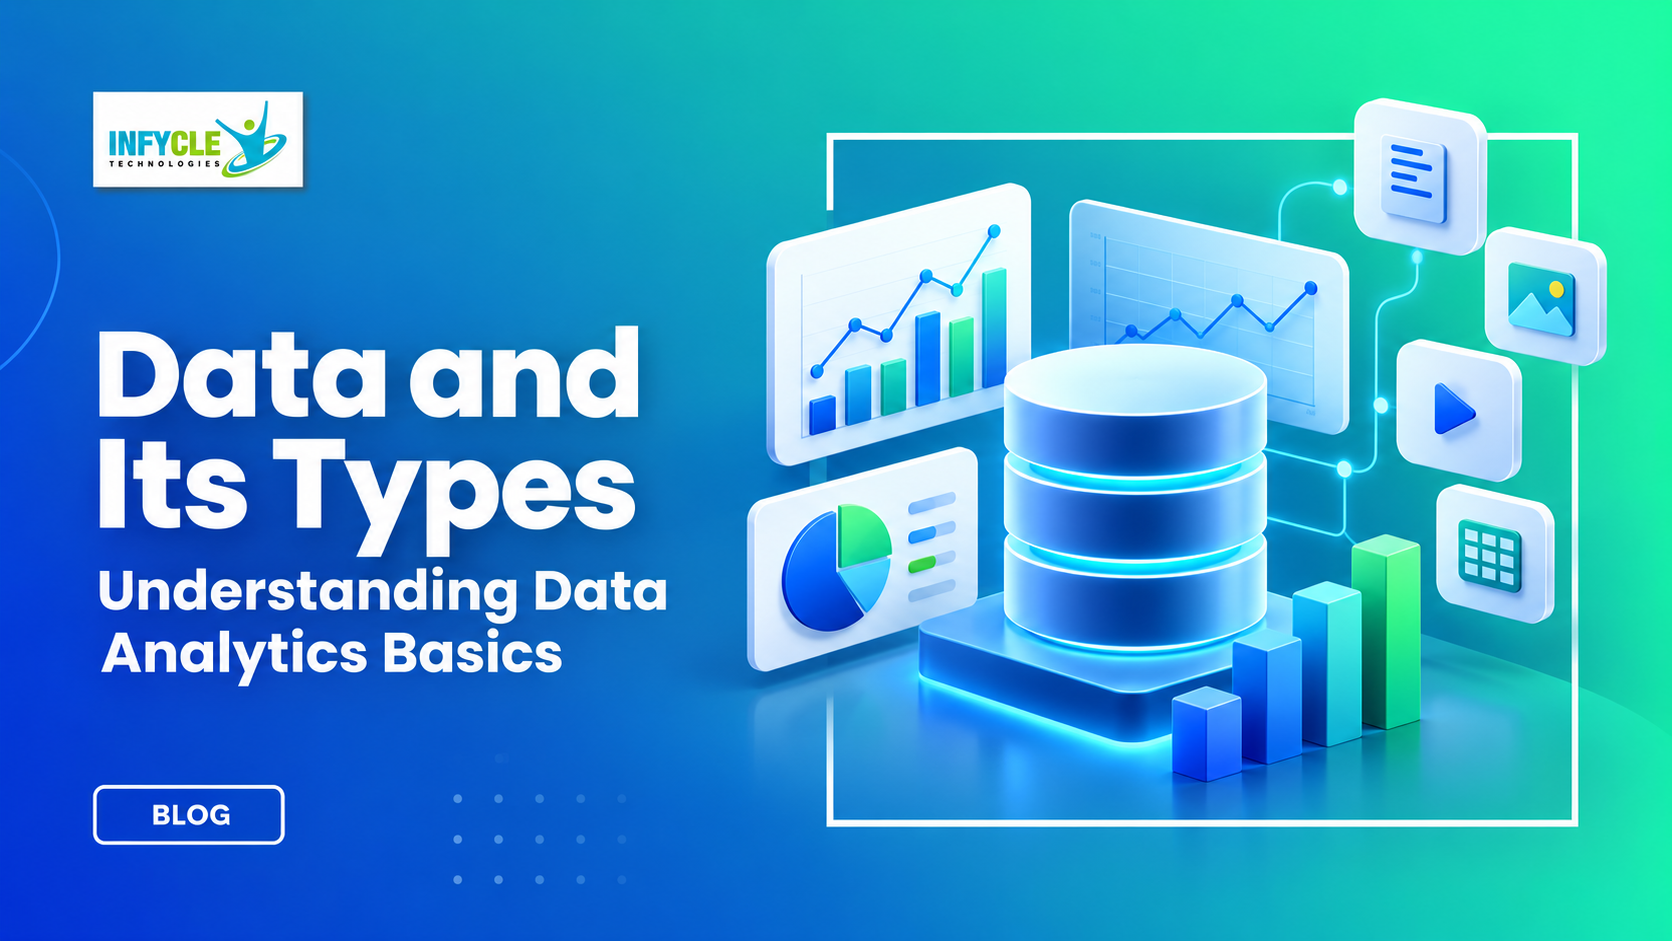
Introduction Data and Its Types form the foundation of data analytics and help businesses understand information clearly. Moreover, learning the basics helps students understand how raw facts […]
Student testimonials
Our Happiness comes from their Success. Short stories from our beloved Students of Infycle.
Trending Courses
| Oracle SQL | Oracle PLSQL | Oracle DBA | Big Data | AWS | Azure | DevOps | Java | Python | Digital Marketing | Data Science |
| Web Development | Full Stack Development | AngularJS | Dot Net | Selenium | Salesforce | Android | iOS | Mainframe |