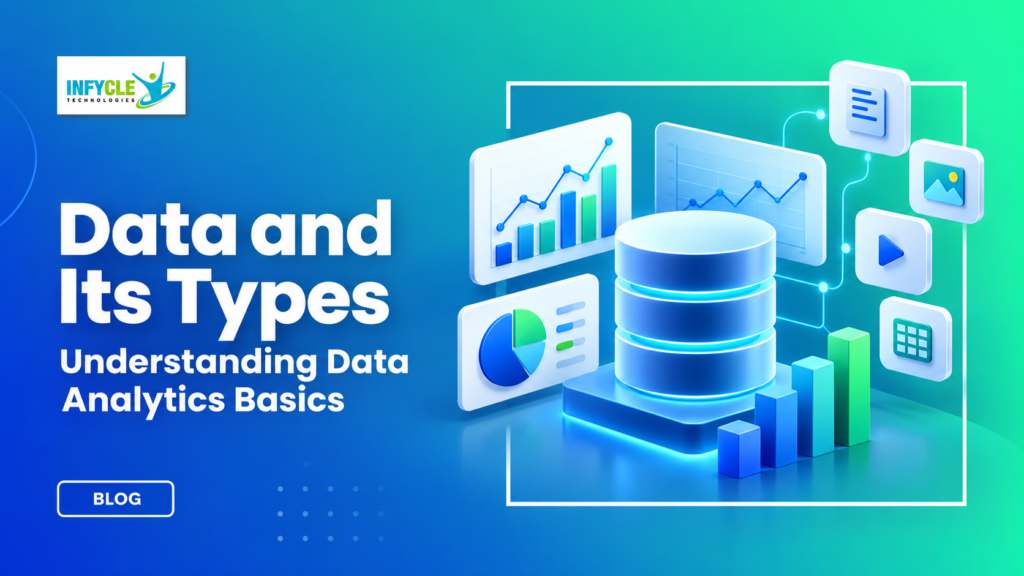
Data and Its Types: Understanding Data Analytics Basics
Introduction
Data and Its Types form the foundation of data analytics and help businesses understand information clearly. Moreover, learning the basics helps students understand how raw facts become useful insights.
For college students, fresh graduates, and career changers, data analytics offers practical opportunities across many industries. In addition, learners in Chennai can build relevant skills through structured training and hands-on projects.
Data can appear as numbers, text, images, transactions, customer details, or website activity. Therefore, knowing different data types is an important first step before learning analytics tools.
Table of Contents
- What is Data and Its Types?
- Why Choose a Data and Its Types Course in Chennai?
- Key Modules Covered in a Data and Its Types Program
- Practical Tools You Master in Data and Its Types Training
- How Data Supports Business Analytics
- Career Opportunities After Completing a Data and Its Types Program
- Self-Learning vs. Hands-on Training at Infycle Technologies
- Frequently Asked Questions About Data and Its Types
What is Data and Its Types?
Data and Its Types describe the different forms of information collected, stored, processed, and analyzed for useful purposes. Furthermore, understanding these forms helps analysts select suitable methods for working with information.
Data can describe people, products, transactions, operations, or business activities. For example, a customer’s age is numerical data, while a customer’s feedback may contain text.
Structured Data
Structured data follows a clear format, usually with rows and columns. For instance, an employee database can contain names, departments, salaries, and joining dates.
Because the structure remains consistent, analysts can easily search, filter, and organize this information. Also, relational databases commonly store structured data.
Unstructured Data
Unstructured data does not follow a fixed tabular format. For example, videos, social media posts, emails, photographs, and audio recordings can fall into this category.
However, unstructured information can still provide valuable business insights. Therefore, analytics teams often use specialized tools to process it.
Semi-Structured Data
Semi-structured data has some organizational features but does not follow a traditional table structure. JSON and XML files are common examples.
In addition, these formats can contain tags, keys, or metadata that provide information about individual values. As a result, systems can process the data while retaining flexible structures.
Qualitative and Quantitative Data
Qualitative data describes qualities, opinions, or characteristics. Meanwhile, quantitative data represents measurable values such as revenue, age, sales, or website visits.
For instance, customer satisfaction comments provide qualitative information. In contrast, a satisfaction score from 1 to 5 provides quantitative information.
Why Choose a Data and Its Types Course in Chennai?
A structured learning path can help Chennai learners understand data concepts through practical examples and exercises. Moreover, instructor guidance can make technical topics easier for beginners.
Many learners start analytics by focusing only on tools. However, understanding data fundamentals helps them use those tools more effectively.
A practical program can introduce:
- Data fundamentals
- Data collection
- Data cleaning
- Data visualization
- Spreadsheet analysis
- SQL basics
- Python for analytics
- Dashboard creation
- Business reporting
Furthermore, projects can help learners connect concepts with workplace situations. Therefore, students can develop both technical knowledge and analytical thinking.
Key Modules Covered in a Data and Its Types Program
A useful analytics program should cover data concepts before moving into advanced analysis. Also, learners should practice each topic using realistic datasets.
Data Collection and Organization
Data collection involves gathering information from suitable sources. For example, businesses may collect customer transactions, website activity, survey responses, and product information.
Next, analysts organize the collected information for further processing. Consequently, clean organization makes later analysis more reliable.
Data Cleaning
Data cleaning identifies and fixes problems within datasets. These problems can include missing values, duplicate records, incorrect formats, and inconsistent entries.
Moreover, clean data improves the quality of analytical results. Therefore, learners should understand cleaning before creating reports or dashboards.
Data Analysis
Data analysis involves examining information to identify patterns, relationships, and useful findings. For instance, an analyst may compare monthly sales to identify changes in customer demand.
Simple techniques can include sorting, filtering, grouping, and calculating averages. Later, learners can explore more advanced statistical methods.
Data Visualization
Data visualization converts information into charts, graphs, and dashboards. In addition, visual reports can make complex information easier for decision-makers to understand.
For example, a sales dashboard can show revenue trends, top products, and regional performance. As a result, users can identify important patterns faster.
Practical Tools You Master in Data and Its Types Training
Practical analytics training should introduce tools that support data preparation, analysis, and reporting. Specifically, learners can practice Excel, SQL, Python, Pandas, Power BI, and visualization techniques.
Excel helps beginners perform calculations and organize datasets. Meanwhile, SQL allows users to retrieve and manage information stored in databases.
Python adds programming capabilities for data processing and analysis. Furthermore, Pandas provides useful structures for working with datasets.
Power BI can help learners create interactive dashboards and business reports. Therefore, combining these tools can provide a broader analytics workflow.
How Data Supports Business Analytics
Data supports business analytics by helping organizations examine performance and make informed decisions. Moreover, analysts can use historical and current information to identify patterns.
For example, an online store can analyze purchase records to identify popular products. Similarly, a marketing team can study campaign data to understand customer engagement.
The process usually follows several steps:
- Collect relevant data.
- Clean and organize the information.
- Explore patterns and relationships.
- Analyze important metrics.
- Create visual reports.
- Communicate useful findings.
However, good analysis depends on accurate data and suitable methods. Therefore, analysts must question the quality and relevance of their datasets.
Career Opportunities After Completing a Data and Its Types Program
Strong data fundamentals can support several analytics-related career paths when combined with practical tools. Furthermore, project experience can help candidates demonstrate their skills during interviews.
Potential roles include:
- Data Analyst
- Business Analyst
- Reporting Analyst
- Junior Data Scientist
- Business Intelligence Analyst
- Data Visualization Specialist
- MIS Analyst
However, data knowledge alone does not guarantee job readiness. Candidates should also develop SQL, Excel, visualization, statistics, communication, and problem-solving skills.
A Data Analytics Course in Chennai can provide a structured path for learners who want practical exposure. In addition, project work can help students build examples for their portfolios.
Self-Learning vs. Hands-on Training at Infycle Technologies
Both approaches can support learning, but their structure and guidance can differ.
| Learning Area | Self-Learning | Hands-on Training at Infycle Technologies |
|---|---|---|
| Learning schedule | Flexible | Structured |
| Trainer support | Limited | Direct guidance |
| Doubt clarification | Self-research | Trainer assistance |
| Practical datasets | Self-selected | Guided exercises |
| Projects | Self-managed | Practical project work |
| Tool practice | Learner-dependent | Structured practice |
| Interview preparation | Self-managed | Career-focused guidance |
Self-learning provides flexibility and access to many resources. On the other hand, hands-on training can provide regular feedback and a defined learning path.
Mid-Article CTA
Want to understand Data and Its Types through practical analytics exercises? Infycle Technologies offers structured analytics training in Chennai with practical assignments, tool-based learning, and career guidance.
Moreover, learners can explore real-world datasets and understand how analytics skills apply to business situations.
Connect with Infycle Technologies to explore the course structure and learning options.
Frequently Asked Questions About Data and Its Types
1. What does Data and Its Types mean?
Data and Its Types refers to different forms of information used for storage, processing, and analysis. Common categories include structured, unstructured, semi-structured, qualitative, and quantitative data.
2. Why is data important in analytics? [Data and Its Types]
Data provides the information analysts need to identify patterns and measure performance. Therefore, reliable data supports meaningful reports and business decisions.
3. Which tools should beginners learn for data analytics? [Data and Its Types]
Beginners can start with Excel and SQL before adding Python and visualization tools. Furthermore, Power BI can help learners develop dashboard and reporting skills.
4. Can beginners learn data analytics?
Yes, beginners can start with basic data concepts and gradually learn analytics tools. However, consistent practice and project work are important for building confidence.
Conclusion
Understanding data fundamentals helps learners build a strong foundation for analytics. Moreover, knowing structured, unstructured, semi-structured, qualitative, and quantitative information makes later topics easier.
Practical experience with Excel, SQL, Python, Pandas, and Power BI can strengthen analytical skills. Therefore, learners should combine concepts with datasets, projects, and regular problem-solving exercises.
For students searching for Data Analytics Course in Chennai, structured training can provide guided learning and practical exposure. In addition, selecting the best software training institute in Chennai should involve checking trainer support, project work, tools, and career guidance.
Ready to start your data analytics journey?
Visit Infycle Technologies Chennai for free career counseling and a live demo. Get guidance on suitable analytics courses, practical projects, tools, and career preparation.
Start building practical analytics skills with a clear learning path today.