Power BI Projects for Beginners: Build a Job-Ready Portfolio
Use up and down arrow keys to resize the meta box pane.
Introduction
Power BI Projects help beginners understand data analytics through practical, real-world business problems. They also help students demonstrate their technical skills to potential employers.
Use up and down arrow keys to resize the meta box pane.
Many fresh graduates learn Excel, SQL, Python and Power BI. However, knowing these tools alone may not demonstrate your ability to analyse business data.
Therefore, building practical dashboards is an important step towards becoming a Data Analyst. You can use Power BI to transform raw data into meaningful reports and interactive visualisations.
For example, a sales dashboard can display revenue, profit, product performance and regional sales. Similarly, an HR dashboard can help businesses understand employee performance and workforce trends.
If you are planning to start a career in data analytics, project experience can strengthen your resume. Moreover, a well-organised portfolio gives interviewers something practical to discuss.
In this guide, you will discover beginner-friendly Power BI Projects, essential skills, real-world dashboard ideas and portfolio-building tips. You will also learn how structured training can support your journey.
Table of Contents
- What Is Power BI and Why Do Beginners Need It?
- Why Are Power BI Projects Important for Freshers?
- What Skills Do You Need Before Starting?
- Top 10 Power BI Projects for Beginners
- How Do You Build a Power BI Project Step by Step?
- What Makes a Power BI Portfolio Job-Ready?
- Self-Learning vs Structured Data Analytics Training
- Career Opportunities After Learning Power BI
- Frequently Asked Questions
- Conclusion
What Is Power BI and Why Do Beginners Need It?
Power BI is a business intelligence tool from Microsoft that helps users analyse data and create interactive dashboards.
It connects different data sources and converts raw information into useful business insights. Furthermore, users can share reports and explore information through interactive filters.
For example, a company can use Power BI to monitor monthly sales, customer behaviour and business performance.
What Are the Main Features of Power BI?
Power BI provides several features that help beginners create meaningful reports.
| Feature | Purpose |
|---|---|
| Power Query | Clean and transform data |
| Data Modelling | Connect related tables |
| DAX | Create calculated measures and columns |
| Visualisations | Display data through charts and graphs |
| Power BI Service | Publish and share reports |
| Slicers | Filter dashboard information |
| Power BI Desktop | Build reports and dashboards |
Additionally, Power BI supports Excel, CSV, SQL Server and other data sources.
Why Are Power BI Projects Important for Freshers?
Power BI Projects help freshers demonstrate their ability to clean data, create dashboards and explain business insights.
Employers often want candidates who can apply their knowledge to practical situations. Therefore, projects provide useful evidence of your technical abilities.
Here are four important benefits:
- Practical knowledge: You understand how analytics works with real datasets.
- Technical skills: You practise Power Query, DAX and data modelling.
- Resume improvement: You can showcase completed projects in your portfolio.
- Interview confidence: You can explain your approach and findings using examples.
For instance, building a sales dashboard helps you understand revenue trends and product performance. Consequently, you can discuss actual analytical decisions during interviews.
Can Beginners Build Power BI Projects Without Experience?
Yes. Beginners can build Power BI Projects without previous industry experience.
However, you should understand basic Excel concepts and simple data analysis first. Next, learn Power BI fundamentals and practise with sample datasets.
Start with simple dashboards before attempting complex business reports. As a result, you can improve your skills gradually.
What Skills Do You Need Before Starting Power BI Projects?
You need basic data handling, data cleaning, visualisation and analytical skills to build useful Power BI Projects.
You do not need to master every technology before starting. Instead, learn the essential concepts and improve them through practice.
| Skill | Why It Matters |
|---|---|
| Excel | Understand spreadsheets and tabular data |
| SQL | Retrieve information from databases |
| Power Query | Clean and transform datasets |
| DAX | Create calculations and measures |
| Data Modelling | Build relationships between tables |
| Data Visualisation | Present information clearly |
| Business Understanding | Identify useful business insights |
Furthermore, basic statistics can help you understand averages, percentages, growth rates and trends.
Which Power BI Concepts Should You Learn First?
Start with Power BI Desktop and understand its main working areas.
Next, practise importing datasets, cleaning columns and creating relationships. Then, learn DAX functions such as SUM, COUNT, CALCULATE and DIVIDE.
Finally, explore different charts, slicers and dashboard layouts.
Top 10 Power BI Projects for Beginners
The best Power BI Projects for beginners focus on common business problems, clear dashboards and meaningful insights.
You can start with simple datasets and gradually move towards advanced analytical tasks. Moreover, each project can demonstrate different Power BI skills.
1. Sales Analysis Dashboard
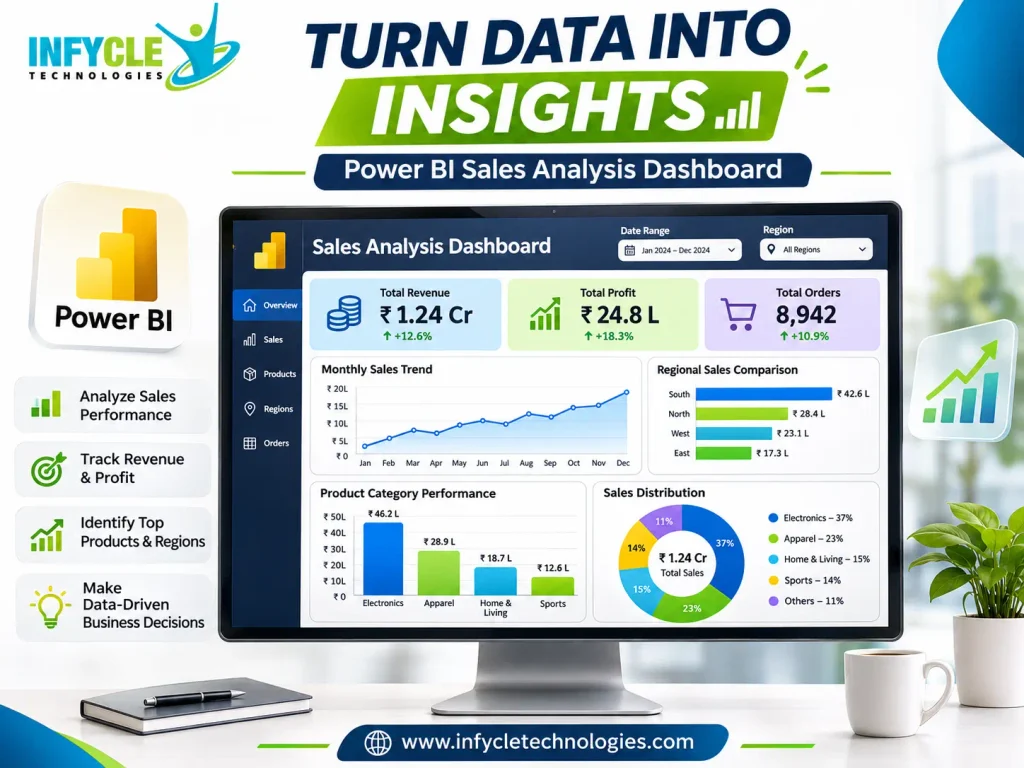
A Sales Analysis Dashboard helps businesses monitor revenue, profit and product performance.
Project objective: Analyse sales data and identify business growth opportunities.
Dataset columns:
- Order ID
- Order Date
- Product Name
- Category
- Region
- Sales Amount
- Quantity
- Profit
Key dashboard elements:
- Total Sales
- Total Profit
- Total Orders
- Monthly Sales Trends
- Region-Wise Sales
- Top-Selling Products
Power BI skills used: Power Query, DAX, bar charts, line charts and slicers.
Business insight example: Identify which region generates the highest revenue and which products contribute most to profit.
2. HR Analytics Dashboard
An HR Analytics Dashboard helps organisations understand employee information and workforce trends.
Project objective: Analyse employee data and identify workforce patterns.
Dataset columns:
- Employee ID
- Department
- Gender
- Age
- Job Role
- Salary
- Joining Date
- Attrition Status
Key dashboard elements:
- Total Employees
- Department-Wise Employees
- Average Salary
- Employee Attrition Rate
- Age Distribution
- Job Role Analysis
Power BI skills used: DAX, calculated columns, pie charts, bar charts and data modelling.
Business insight example: Identify departments with higher employee attrition and examine possible workforce trends.
3. E-Commerce Sales Dashboard
An E-Commerce Sales Dashboard tracks online orders, customer purchases and product performance.
Project objective: Understand online shopping patterns and business performance.
Dataset columns:
- Order ID
- Customer ID
- Product Category
- Order Date
- Payment Method
- Order Status
- Sales
- Quantity
Key dashboard elements:
- Total Revenue
- Total Orders
- Customer Count
- Category-Wise Sales
- Payment Method Analysis
- Monthly Revenue Trends
Power BI skills used: Data transformation, DAX, filters and interactive visualisations.
Business insight example: Find popular product categories and identify periods with higher customer purchases.
4. Financial Analysis Dashboard
A Financial Analysis Dashboard helps businesses compare income, expenses and profitability.
Project objective: Monitor financial performance and identify spending patterns.
Dataset columns:
- Transaction ID
- Date
- Department
- Income
- Expenses
- Budget
- Actual Amount
Key dashboard elements:
- Total Income
- Total Expenses
- Net Profit
- Budget vs Actual
- Department-Wise Expenses
- Monthly Financial Trends
Power BI skills used: DAX calculations, KPI cards, conditional formatting and line charts.
Business insight example: Identify departments that exceed their planned budgets and analyse expense trends.
5. Student Performance Dashboard
A Student Performance Dashboard helps educational institutions monitor academic results and attendance.
Project objective: Analyse student performance across subjects and departments.
Dataset columns:
- Student ID
- Student Name
- Department
- Subject
- Marks
- Attendance
- Semester
- Result
Key dashboard elements:
- Total Students
- Average Marks
- Pass Percentage
- Subject-Wise Performance
- Attendance Analysis
- Department-Wise Results
Power BI skills used: Data cleaning, calculated measures, charts and slicers.
Business insight example: Identify subjects with lower pass percentages and students who may need additional academic support.
6. Inventory Management Dashboard
An Inventory Management Dashboard helps businesses monitor stock levels and product availability.
Project objective: Track inventory and identify products that need replenishment.
Dataset columns:
- Product ID
- Product Name
- Category
- Warehouse
- Available Stock
- Reorder Level
- Unit Price
Key dashboard elements:
- Total Products
- Available Stock
- Low-Stock Products
- Category-Wise Inventory
- Warehouse-Wise Stock
- Reorder Alerts
Power BI skills used: Conditional formatting, DAX, filters and table visualisations.
Business insight example: Identify products below their reorder levels to support timely stock replenishment.
7. Customer Analysis Dashboard
A Customer Analysis Dashboard helps businesses understand customer behaviour and purchasing patterns.
Project objective: Analyse customer segments and identify valuable customer groups.
Dataset columns:
- Customer ID
- Age
- Gender
- Location
- Purchase Amount
- Order Count
- Customer Type
Key dashboard elements:
- Total Customers
- Average Purchase Value
- Customer Segmentation
- Location-Wise Customers
- Repeat Purchase Analysis
- Customer Spending Trends
Power BI skills used: DAX, data modelling, filters and interactive charts.
Business insight example: Identify customer groups that contribute most to overall sales.
8. Healthcare Analytics Dashboard
A Healthcare Analytics Dashboard helps healthcare organisations understand patient and hospital activity.
Project objective: Analyse patient records and hospital operations using suitable sample data.
Dataset columns:
- Patient ID
- Age
- Gender
- Department
- Admission Date
- Discharge Date
- Treatment Type
Key dashboard elements:
- Total Admissions
- Department-Wise Patients
- Monthly Admissions
- Average Length of Stay
- Age Group Analysis
- Patient Distribution
Power BI skills used: Date functions, DAX, data modelling and visualisations.
Business insight example: Identify departments with higher admission volumes and understand monthly patient trends.
Use synthetic or properly anonymised data for portfolio projects.
9. Supermarket Sales Dashboard
A Supermarket Sales Dashboard helps retail businesses analyse branch performance and product sales.
Project objective: Compare sales across branches, products and customer groups.
Dataset columns:
- Invoice ID
- Branch
- City
- Product Line
- Customer Type
- Payment Method
- Quantity
- Total Sales
Key dashboard elements:
- Total Revenue
- Branch-Wise Sales
- Product Line Performance
- Customer Type Analysis
- Payment Method Distribution
- Daily Sales Trends
Power BI skills used: Power Query, DAX, slicers and multiple chart types.
Business insight example: Identify the best-performing branches and product categories using sales data.
10. Marketing Campaign Analysis Dashboard
A Marketing Campaign Dashboard helps marketing teams evaluate campaign performance and customer engagement.
Project objective: Measure marketing results and compare campaign performance.
Dataset columns:
- Campaign ID
- Campaign Name
- Platform
- Impressions
- Clicks
- Leads
- Conversions
- Advertising Cost
Key dashboard elements:
- Total Impressions
- Total Clicks
- Total Leads
- Conversion Rate
- Cost Per Lead
- Campaign-Wise Performance
Power BI skills used: DAX, KPI cards, calculated measures and interactive dashboards.
Business insight example: Compare campaign conversion rates and identify campaigns with lower cost per lead.
How Do You Build a Power BI Project Step by Step?
You can build a Power BI project by following seven practical steps, from collecting raw data to publishing your final dashboard.
Step 1: Choose a Dataset
First, select a dataset related to your project topic.
For example, choose sales data for a Sales Analysis Dashboard. You can find practice datasets through Kaggle and Microsoft’s Power BI learning resources.
Step 2: Import Data into Power BI
Next, open Power BI Desktop and import your dataset.
You can import data from:
- Excel files
- CSV files
- SQL databases
- Web sources
- Other supported connectors
Step 3: Clean Data Using Power Query
Data cleaning improves the quality of your analysis.
For instance, remove duplicate records and handle missing values. Furthermore, correct column names, data types and unwanted spaces.
Step 4: Create Data Relationships
Connect related tables using suitable keys.
For example, connect the Orders table with the Products table using Product ID. Consequently, you can analyse product information alongside order details.
Step 5: Create DAX Measures
DAX helps you perform calculations and create meaningful business metrics.
For example:
Total Sales = SUM(Sales[SalesAmount])Calculate total profit:
Total Profit = SUM(Sales[Profit])Calc total orders:
Total Orders = DISTINCTCOUNT(Sales[OrderID])Calc profit margin:
Profit Margin =
DIVIDE([Total Profit], [Total Sales], 0) * 100
These measures help users understand business performance.
Step 6: Design Interactive Dashboards
Now, select suitable charts and dashboard elements.
For example, use cards for KPIs and line charts for monthly trends. Additionally, add slicers to filter information by date, region and category.
Step 7: Analyse and Present Insights
Finally, review your dashboard and identify important findings.
Do not simply display charts. Instead, explain what the results mean and how businesses can use them.
For example, highlight the highest-performing region and discuss possible reasons behind its sales growth.
What Makes a Power BI Portfolio Job-Ready?
A job-ready Power BI portfolio should demonstrate your technical skills, business understanding and ability to explain analytical findings.
Simply uploading dashboard screenshots is not enough. Therefore, present every project with a clear explanation.
What Should You Include in Each Project?
Include these essential details:
- Project Title: Give your project a clear name.
- Business Objective: Explain the problem you want to solve.
- Dataset: Mention the data source and important columns.
- Tools Used: List Power BI, Excel, SQL and other tools.
- Data Cleaning: Describe the transformations you performed.
- DAX Measures: Explain important calculations.
- Dashboard Screenshots: Show your final report pages.
- Key Insights: Summarise the important findings.
- GitHub or Portfolio Link: Share supporting files and documentation where appropriate.
Where Can You Showcase Your Power BI Projects?
You can use different platforms to present your work.
| Platform | How You Can Use It |
|---|---|
| Share dashboard screenshots and project summaries | |
| GitHub | Upload documentation, datasets and supporting files |
| Power BI Service | Publish and share suitable reports |
| Personal Portfolio | Display projects and technical skills |
| Resume | Include project names and measurable contributions |
However, check data licensing and privacy before sharing datasets or reports publicly.
Self-Learning vs Structured Data Analytics Training: Which Is Better?
Both learning methods can help you develop Power BI skills. However, structured training provides a guided learning path and opportunities for trainer feedback.
| Factors | Self-Learning | Structured Training |
|---|---|---|
| Learning schedule | Flexible | Planned sessions |
| Trainer support | Limited | Direct guidance |
| Doubt clarification | Independent research | Trainer assistance |
| Practical projects | Self-managed | Guided assignments |
| Learning path | Self-planned | Structured curriculum |
| Progress tracking | Independent | Regular feedback |
| Interview preparation | Self-managed | May include guided practice |
How Does Data Analytics Training Help Beginners?
Structured Data Analytics Training helps beginners understand tools through practical exercises and guided projects.
For example, students can practise Excel, SQL, Python and Power BI using sample business datasets. Furthermore, trainer feedback can help them identify mistakes and improve their dashboards.
If you are looking for Data Analytics Training in Chennai, choose a program that includes practical assignments, project development and interview preparation.
How Can Power BI Projects Help Your Career?
Power BI Projects can help demonstrate your ability to analyse information and communicate business insights.
Many entry-level analytics roles involve working with reports, spreadsheets, databases and dashboards. Therefore, practical project experience can support your job preparation.
Which Job Roles Can You Explore After Learning Power BI?
Power BI skills can support several career paths, depending on your additional technical knowledge.
| Job Role | Important Skills |
|---|---|
| Power BI Developer | Power BI, DAX and data modelling |
| Data Analyst | Excel, SQL and Power BI |
| Business Analyst | Business analysis and visualisation |
| MIS Analyst | Excel, reporting and Power BI |
| Reporting Analyst | SQL, dashboards and data reporting |
| Junior BI Analyst | Data modelling and business intelligence |
Additionally, combining Power BI with SQL and Python can help you explore broader analytics opportunities.
How Can Freshers Explain Power BI Projects in Interviews?
Freshers should explain the business problem, dataset, tools, calculations and insights behind each project.
Use this simple structure:
- What problem did you solve?
- Where did you get the dataset?
- How did you clean the data?
- Which DAX measures did you create?
- Why did you choose specific visualisations?
- What insights did you discover?
For example, when presenting a sales dashboard, explain how you calculated revenue and identified top-performing products.
As a result, interviewers can understand your actual contribution rather than just seeing dashboard screenshots.
Learn Data Analytics with Practical Training at Infycle Technologies, Chennai
Power BI: la herramienta clave para el análisis de datos
enae.es
Are you interested in building a career in Data Analytics? Infycle Technologies offers practical learning opportunities for students and fresh graduates.
Our training approach covers essential analytics tools and helps students understand how businesses use data.
What can you learn?
- Excel for data analysis and reporting.
- SQL for database management.
- Python for data analysis.
- NumPy and Pandas.
- Data cleaning and preprocessing.
- Exploratory Data Analysis (EDA).
- Power BI dashboards and visualisations.
- DAX calculations and data modelling.
- Practical analytics projects.
- Resume guidance and interview preparation.
Furthermore, project-based exercises help students apply their knowledge to practical business scenarios.
If you are searching for a Data Analytics Course in Chennai, explore the course details at Infycle Technologies.
Frequently Asked Questions About Power BI Projects
1. Which Power BI project is best for beginners?
A Sales Analysis Dashboard is a suitable starting project for beginners. It covers data cleaning, DAX measures, charts and filters. Additionally, it helps students understand revenue, profit and product performance through simple business scenarios.
2. How many Power BI Projects should I include in my resume?
Include three to five well-documented Power BI Projects in your portfolio. Choose different business areas, such as sales, HR and finance. Furthermore, explain your dataset, calculations, dashboard design and findings to demonstrate practical knowledge.
3. Can I learn Power BI without knowing SQL?
Yes, you can start learning Power BI without SQL knowledge. Power BI supports Excel and CSV files for beginner projects. However, learning SQL later helps you retrieve, filter and analyse information from relational databases.
4. Do Power BI Projects help freshers get jobs?
Yes, practical projects can strengthen a fresher’s portfolio by demonstrating analytical and technical skills. However, projects alone cannot guarantee employment. Therefore, combine Power BI knowledge with SQL, Excel, business understanding and interview preparation.
5. What should I learn before starting a Data Analytics Course in Chennai?
Start with basic Excel, mathematics and data handling concepts. Next, learn SQL, Python and Power BI. Furthermore, practise data cleaning, visualisation and dashboard development through projects to build confidence in analytics.
Conclusion
Power BI Projects are an effective way for beginners to develop practical data analytics skills and demonstrate their knowledge.
Start with simple projects such as sales analysis and student performance dashboards. Next, explore HR analytics, financial reporting and marketing campaign analysis.
Furthermore, practise Power Query, DAX, data modelling and dashboard design. Most importantly, document your projects and explain the business insights behind your findings.
If you want to develop these skills through guided learning, consider a Data Analytics Course in Chennai at Infycle Technologies.
Build your portfolio, improve your technical knowledge and prepare for opportunities in the data analytics field.