What is Exploratory Data Analysis?

Exploratory Data Analysis (EDA) is the process of examining, cleaning, and understanding data before building models or making business decisions. It helps analysts discover patterns, trends, relationships, and unusual values.
For example, a company may collect thousands of customer records. However, raw data alone does not explain what customers are doing. Therefore, analysts use Exploratory Data Analysis to understand the data clearly.
EDA combines statistics, visualization, and logical investigation. Moreover, it helps identify missing values, duplicate records, and outliers. As a result, analysts can work with cleaner and more reliable datasets.
For beginners, EDA is an important skill in data analytics. You can learn it using tools such as Python, Pandas, NumPy, Matplotlib, Seaborn, and SQL. In addition, EDA skills can support careers in data analytics, business intelligence, and data science.
If you are searching for Data Analytics Training in Chennai, learning EDA can give you a strong practical foundation.
Table of Contents
- What is Exploratory Data Analysis?
- Why is Exploratory Data Analysis important?
- What are the main objectives of Exploratory Data Analysis?
- What are the steps in Exploratory Data Analysis?
- Which tools are used for Exploratory Data Analysis?
- How does Exploratory Data Analysis help beginners?
- What is the difference between EDA and data analysis?
- What are common EDA techniques?
- Exploratory Data Analysis example
- Self-learning vs structured data analytics training
- How can you learn Exploratory Data Analysis in Chennai?
- Frequently Asked Questions
- Conclusion
What is Exploratory Data Analysis?
Exploratory Data Analysis is a systematic way to understand a dataset before deeper analysis or modeling. Therefore, it usually comes before predictive modeling and advanced machine learning.
EDA helps answer simple but important questions:
- What data do we have?
- How large is the dataset?
- Are values missing?
- Are there duplicate records?
- What values occur most often?
- Are there unusual values?
- Which variables are related?
- What patterns can we find?
For instance, suppose a company has sales data for 10,000 customers. An analyst can use EDA to find the best-selling products, highest-revenue cities, and monthly sales trends.
Moreover, EDA makes complex datasets easier to understand. Consequently, analysts can make better decisions based on evidence.
Why is Exploratory Data Analysis important?
Exploratory Data Analysis is important because it reveals data quality problems and useful patterns before analysis begins. Therefore, it reduces the risk of making decisions from incorrect or incomplete data.
Raw datasets often contain problems. For example, they may include missing values, duplicate rows, incorrect formats, or extreme values.
However, these problems may not be obvious at first. EDA helps analysts detect them early.
Furthermore, EDA supports better decision-making. Once analysts understand the data, they can select suitable statistical methods and visualization techniques.
How does Exploratory Data Analysis improve data quality?
Exploratory Data Analysis improves data quality by identifying missing, duplicated, inconsistent, and unusual values. As a result, analysts can clean the dataset before using it.
For example, an employee dataset may contain salaries such as ₹30,000, ₹35,000, and ₹3,50,000. The last value may be correct, or it may be a data-entry error.
Therefore, the analyst must investigate the value instead of automatically deleting it.
Similarly, EDA can identify missing customer ages, repeated customer IDs, and inconsistent city names. Thus, data cleaning becomes more accurate.
What are the main objectives of Exploratory Data Analysis?
The main objective of Exploratory Data Analysis is to understand the structure, quality, distribution, and relationships within a dataset. In addition, EDA helps analysts form useful questions for further investigation.
The major objectives include:
- Understanding the dataset – Learn about rows, columns, and data types.
- Finding missing values – Identify incomplete records.
- Detecting duplicates – Find repeated observations.
- Identifying outliers – Detect unusual values.
- Understanding distributions – Study how values are spread.
- Finding relationships – Examine connections between variables.
- Discovering patterns – Identify useful trends.
- Supporting decision-making – Convert raw data into useful information.
Moreover, these objectives apply across many industries. For instance, analysts can use EDA in finance, healthcare, retail, education, marketing, and logistics.
What are the steps in Exploratory Data Analysis?
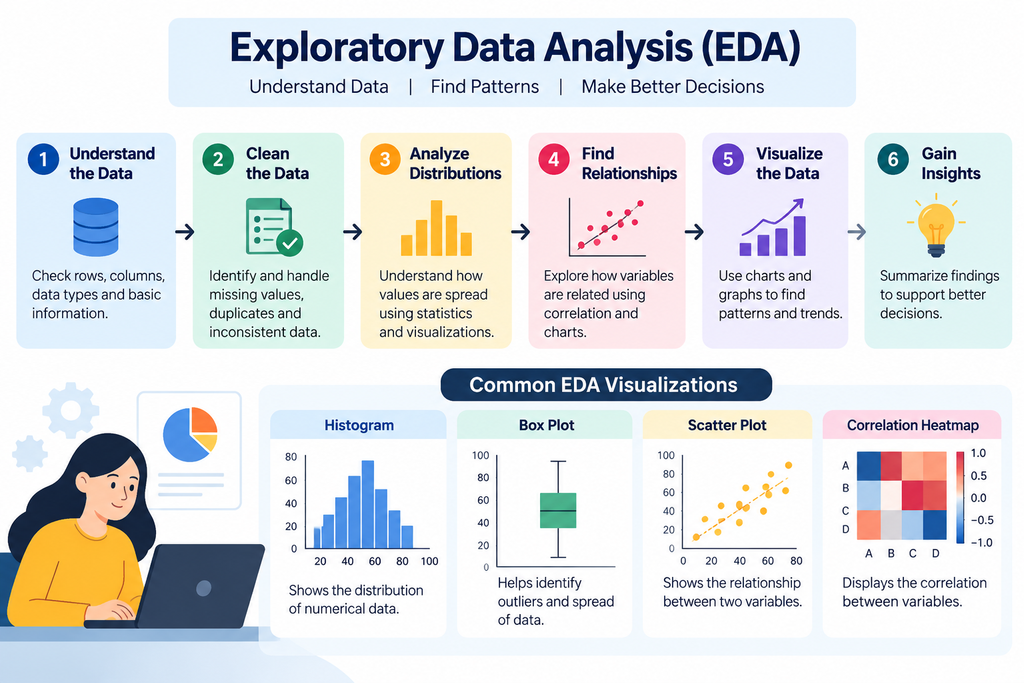
The main steps in Exploratory Data Analysis include collecting, understanding, cleaning, summarizing, visualizing, and interpreting data. However, analysts may repeat these steps when they discover new issues.
1. Understand the dataset
The first step is to understand what the dataset contains. Therefore, analysts inspect columns, rows, data types, and basic statistics.
In Python, Pandas makes this process simple.
For example:
df.head()
df.info()
df.shape
df.describe()
These commands provide a quick overview of the dataset.
2. Check missing values
The next step is to identify missing values in important columns. Consequently, analysts can decide whether to remove, replace, or investigate those values.
For example:
df.isna().sum()This command shows the number of missing values in each column.
3. Find duplicate records
Duplicate records can affect analysis results, so analysts should identify them early. For example, the same customer may appear twice because of an accidental duplicate entry.
You can check duplicates using:
df.duplicated().sum()Furthermore, you can remove duplicates when they are confirmed as errors.
df.drop_duplicates()4. Analyze data distributions
Distribution analysis shows how values are spread across a dataset. Therefore, analysts can understand common values, ranges, and unusual observations.
For example, a histogram can show the distribution of employee salaries.
Similarly, a box plot can help identify potential outliers.
5. Study relationships
Relationship analysis helps analysts understand how two or more variables interact. For instance, an analyst may compare advertising spending with sales revenue.
Correlation analysis can also reveal relationships between numerical variables.
df.corr(numeric_only=True)However, correlation does not automatically prove that one variable causes another.
6. Visualize the findings
Data visualization converts complex numerical information into easier-to-understand visuals. Moreover, charts can reveal patterns that are difficult to notice in raw tables.
Common EDA charts include:
- Bar charts
- Histograms
- Box plots
- Scatter plots
- Line charts
- Pie charts
- Heatmaps
Therefore, visualization is one of the most important parts of EDA.
Which tools are used for Exploratory Data Analysis?
Popular Exploratory Data Analysis tools include Python, Pandas, NumPy, Matplotlib, Seaborn, SQL, Excel, and Power BI. However, the best tool depends on the dataset and business requirement.
| Tool | Common EDA Use |
|---|---|
| Python | Data analysis and automation |
| Pandas | Data cleaning and manipulation |
| NumPy | Numerical operations |
| Matplotlib | Data visualization |
| Seaborn | Statistical visualization |
| SQL | Database exploration |
| Excel | Basic analysis and reporting |
| Power BI | Interactive dashboards |
For beginners, Python and Pandas provide a strong starting point. Additionally, SQL is important because many companies store business data in databases.
How does Exploratory Data Analysis help beginners?
Exploratory Data Analysis helps beginners learn how to think about data before jumping into advanced tools or machine learning. Therefore, it builds practical analytical thinking.
Beginners often focus only on learning syntax. However, real data work requires more than writing code.
You must ask useful questions. You must understand the data. Furthermore, you must explain what the results mean.
For example, instead of simply creating a sales chart, an analyst should ask:
- Which product generates the most revenue?
- Which month has the highest sales?
- Which location performs poorly?
- Why did sales change?
- Are there unusual transactions?
As a result, EDA helps students move from coding exercises toward real business analysis.
What is the difference between EDA and data analysis?
EDA focuses on discovering patterns and understanding data, while broader data analysis can include answering specific business questions and making decisions. Therefore, EDA is often an important stage within the larger data analysis process.
| Exploratory Data Analysis | Data Analysis |
|---|---|
| Explores the dataset | Answers defined questions |
| Finds patterns | Measures performance |
| Detects unusual values | Produces business insights |
| Uses charts and statistics | Uses multiple analytical methods |
| Often starts the process | Can include EDA and reporting |
For example, EDA may reveal that Chennai sales increased during a particular month. Later, data analysis can investigate why the increase happened.
What are common Exploratory Data Analysis techniques?
Common EDA techniques include descriptive statistics, frequency analysis, visualization, correlation analysis, and outlier detection. Moreover, analysts often combine several techniques for better results.
Descriptive statistics
Descriptive statistics summarize numerical data. Common measures include:
- Mean
- Median
- Mode
- Minimum
- Maximum
- Standard deviation
- Percentiles
For example, the average salary can provide a quick overview of employee compensation.
Frequency analysis
Frequency analysis shows how often values occur. For instance, you can count customers by city or products by category.
In Pandas, you can use:
df["category"].value_counts()Outlier detection
Outliers are unusually high or low values. Therefore, analysts should investigate them before drawing conclusions.
Box plots and statistical methods can help identify potential outliers.
Correlation analysis
Correlation measures the relationship between numerical variables. For example, analysts may study the relationship between study hours and examination scores.
However, correlation does not necessarily mean causation.
What is an Exploratory Data Analysis example?
A simple sales dataset provides a practical example of Exploratory Data Analysis. Suppose a retail company has columns for order date, product, city, quantity, price, and revenue.
First, the analyst checks the dataset structure. Next, they identify missing and duplicate records.
Then, the analyst calculates total revenue by product.
df.groupby("product")["revenue"].sum()Afterward, the analyst can create a monthly sales chart.
Furthermore, the analyst can compare Chennai sales with sales from other cities.
Finally, the analyst summarizes the findings for business teams. As a result, the company can identify strong products, weak locations, and seasonal sales patterns.
This simple process demonstrates how EDA turns raw records into useful business insights.
Self-Learning vs Structured Data Analytics Training
Self-learning offers flexibility, while structured training provides a guided learning path, practical projects, and mentor support. Therefore, beginners should choose based on their learning style and career goals.
| Factor | Self-Learning | Structured Training |
|---|---|---|
| Learning path | You create it | Guided curriculum |
| Mentor support | Limited | Available |
| Practice | Self-managed | Project-based |
| Doubt clarification | Online resources | Trainer support |
| Career guidance | Usually limited | Often included |
| Discipline | Requires self-motivation | Scheduled learning |
| Real projects | Depends on learner | Usually structured |
However, self-learning can work well for highly disciplined learners. On the other hand, structured training can reduce confusion for absolute beginners.
Therefore, students searching for a Data Analytics Course in Chennai should compare syllabus, practical sessions, projects, trainer experience, and career support before enrolling.
How can you learn Exploratory Data Analysis in Chennai?
You can learn Exploratory Data Analysis in Chennai through practical data analytics training that combines Python, SQL, statistics, visualization, and projects. Furthermore, project-based learning helps you understand how EDA works with real datasets.
At Infycle Technologies, learners can build foundational skills through practical training. The learning path can include Python, Pandas, NumPy, SQL, data visualization, statistics, and analytics projects.
Moreover, Chennai has opportunities across IT services, startups, consulting, finance, healthcare, retail, and other sectors. Therefore, practical data analytics skills can help fresh graduates and career changers prepare for entry-level opportunities.
Before selecting Data Analytics Training in Chennai, check whether the program provides:
- Practical coding sessions
- Real-world datasets
- Python and Pandas training
- SQL practice
- Statistics fundamentals
- Data visualization
- Portfolio projects
- Interview preparation
- Career guidance
- Trainer support
Consequently, choosing practical training can help you develop skills beyond textbook knowledge.
Frequently Asked Questions
What is Exploratory Data Analysis in simple words?
Exploratory Data Analysis means examining data to understand its patterns, problems, relationships, and important values. For example, analysts use EDA to find missing data, duplicates, outliers, trends, and relationships before making business decisions or building predictive models.
Why is Exploratory Data Analysis important?
Exploratory Data Analysis is important because it helps analysts understand data before making conclusions. It can reveal missing values, duplicate records, unusual observations, trends, and relationships. Therefore, EDA improves data quality and supports more reliable analysis and business decisions.
Which programming language is best for EDA?
Python is one of the most popular programming languages for EDA because it provides powerful data analysis libraries. For example, Pandas handles datasets, NumPy supports numerical operations, while Matplotlib and Seaborn create useful visualizations for analysis.
Is EDA difficult for beginners?
EDA is not difficult when beginners learn it step by step with practical datasets. First, students can learn data types and Pandas. Next, they can practice cleaning, statistics, visualization, and grouping. Therefore, consistent practice makes EDA easier.
What should I learn before EDA?
Basic Python, statistics, and spreadsheet concepts provide a useful foundation for EDA. However, beginners do not need advanced programming skills. They can start with Python basics, then learn Pandas, NumPy, SQL, visualization, and descriptive statistics through practical exercises.
Build Practical Data Analytics Skills with Infycle Technologies
Practical training can help you understand EDA faster because you apply concepts to real datasets. Therefore, Infycle Technologies focuses on skills that learners can practice through examples and projects.
You can learn concepts such as Python, SQL, data cleaning, statistics, visualization, and Exploratory Data Analysis.
Moreover, practical exercises can help you create projects for your portfolio. As a result, you can explain your analytical approach more confidently during interviews.
Interested in building data analytics skills? Explore Data Analytics Training in Chennai with Infycle Technologies and start learning through practical sessions.
Conclusion
Exploratory Data Analysis is a fundamental process for understanding data, identifying problems, discovering patterns, and generating useful insights. Therefore, it is an important skill for anyone planning a career in data analytics.
EDA starts with simple steps such as understanding datasets and checking missing values. Next, analysts use statistics, grouping, visualization, and correlation to discover useful information.
Furthermore, tools such as Python, Pandas, NumPy, SQL, Matplotlib, and Seaborn make EDA practical and accessible.
For beginners, the best approach is consistent hands-on practice. Therefore, if you are looking for Data Analytics Training in Chennai, choose a program that combines concepts, practical exercises, real datasets, and projects.
With the right learning path, you can gradually build the skills needed for entry-level data analytics roles.
Start Learning Data Analytics in Chennai
Ready to learn data analytics practically? Join Infycle Technologies and explore practical training designed for students, fresh graduates, career changers, and beginners.
Book a free demo class in Chennai and take your first step toward a data analytics career.