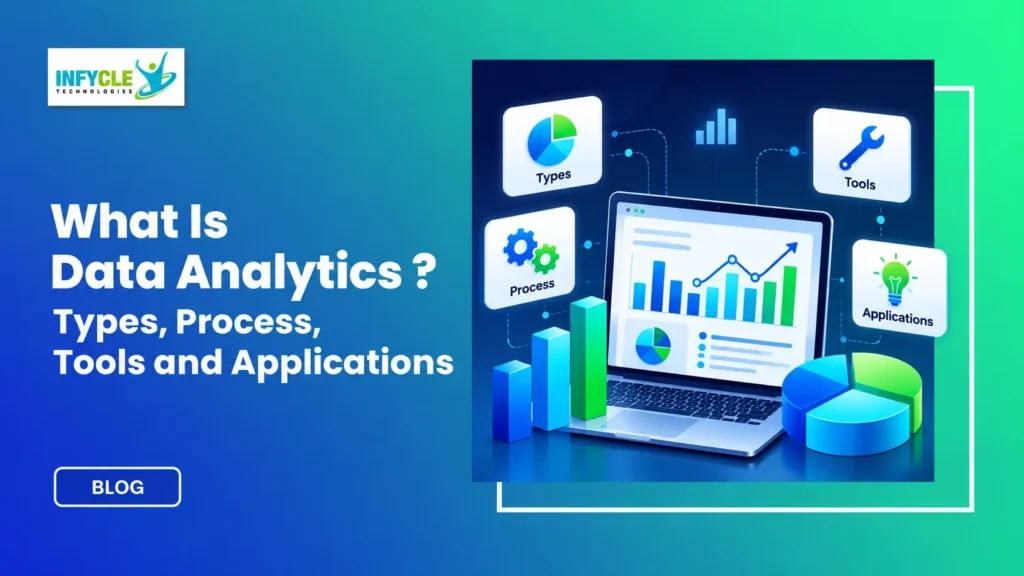
What Is Data Analytics? Types, Process, Tools and Applications
Introduction
What Is Data Analytics? Data analytics is the process of collecting, cleaning, examining, and interpreting data to discover useful insights and support better decisions.
Businesses generate large amounts of data through websites, mobile apps, sales, customer interactions, and daily operations. However, raw data alone cannot explain what is happening or why it matters. Therefore, organisations use data analytics to identify patterns, measure performance, and solve business problems.
For example, an online store can analyse customer purchases to identify popular products. Similarly, a hospital can study patient records to improve its services. In addition, companies can use analytics to understand customer behaviour and plan future strategies.
Data analytics is useful across industries, including healthcare, banking, retail, education, and information technology. Consequently, learning this skill can open up opportunities for students, fresh graduates, and career changers.
This guide explains what data analytics means, its main types, the analytics process, popular tools, and real-world applications. Furthermore, it introduces beginner-friendly skills and learning steps. If you want to enter this field, Data Analytics Training in Chennai can help you build practical knowledge through structured learning and project work.
Table of Contents
- What Is Data Analytics?
- Why Is Data Analytics Important?
- What Are the Types of Data Analytics?
- How Does the Data Analytics Process Work?
- Which Tools Are Used in Data Analytics?
- What Are the Applications of Data Analytics?
- What Is the Difference Between Data Analytics and Data Science?
- What Skills Do Beginners Need?
- How Can You Learn Data Analytics?
- Self-Learning vs. Structured Training
- Frequently Asked Questions
1. What Is Data Analytics?
Data analytics is the practice of examining data to discover patterns, answer questions, and support decisions. It turns raw information into insights that people can understand and use.
For example, a supermarket may record daily sales, product prices, and customer purchases. By analysing this information, the store can identify its best-selling products and plan stock levels more effectively.
Furthermore, data analytics combines several activities, such as data collection, cleaning, exploration, visualisation, and interpretation. Each activity helps analysts understand the information more clearly.
Key objectives of data analytics include:
- Identifying patterns and trends in data.
- Understanding customer needs and behaviour.
- Measuring business performance.
- Finding problems and opportunities.
- Supporting decisions with evidence.
- Forecasting possible future outcomes.
Therefore, data analytics helps organisations move beyond guesswork and make more informed decisions.
2. Why Is Data Analytics Important?
Data analytics is important because it helps organisations make evidence-based decisions, improve efficiency, and understand changing customer needs. Moreover, it allows businesses to measure results instead of relying only on assumptions.
Consider an online shopping company experiencing fewer sales. Instead of guessing the reason, analysts can examine website traffic, product prices, customer feedback, and checkout activity.
As a result, they may discover that many customers leave before completing payment. The company can then investigate the checkout process and test possible improvements.
Here are the main benefits of data analytics:
- Better decisions: Data provides evidence for business planning.
- Cost reduction: Analysis can reveal waste and inefficient processes.
- Customer understanding: Businesses can identify preferences and buying patterns.
- Performance tracking: Reports show whether targets are being met.
- Risk identification: Analysts can detect unusual patterns and potential problems.
- Competitive advantage: Insights help businesses respond to market changes.
In addition, data analytics supports everyday decisions in education, healthcare, finance, and public services.
3. What Are the Types of Data Analytics?
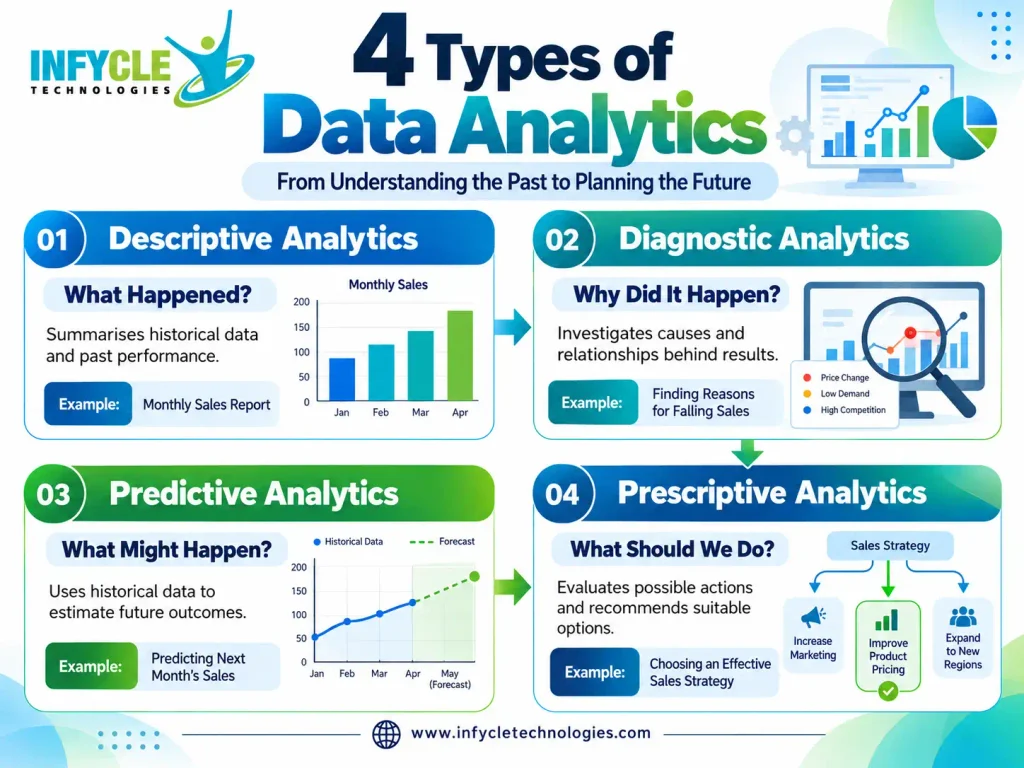
The four main types of data analytics are descriptive, diagnostic, predictive, and prescriptive analytics. Each type answers a different business question, from understanding past performance to choosing future actions.
3.1 What Is Descriptive Analytics?
Descriptive analytics explains what happened by summarising historical data. It uses reports, charts, dashboards, and basic calculations to show past performance.
For example, a retail manager can review monthly sales to identify the highest-performing products. Similarly, a training institute can track enrolments across different courses.
Common techniques include:
- Data aggregation
- Summary statistics
- Reports and dashboards
- Charts and graphs
Therefore, descriptive analytics provides a starting point for understanding business performance.
3.2 What Is Diagnostic Analytics?
Diagnostic analytics investigates why something happened by examining relationships, differences, and possible causes. It helps analysts move beyond reporting results.
For example, a company may notice that sales dropped in one month. Analysts can compare product prices, marketing campaigns, customer visits, and previous sales figures to investigate the decline.
However, finding a relationship does not automatically prove causation. Analysts must examine the evidence carefully before concluding why an event occurred.
3.3 What Is Predictive Analytics?
Predictive analytics uses historical data, statistical methods, and sometimes machine learning to estimate future outcomes. It helps organisations prepare for possible events.
For example, a retailer can use previous sales, seasonal trends, and promotions to estimate future demand. Similarly, a bank may use predictive models to assess certain financial risks.
Nevertheless, predictions are estimates rather than guarantees. Their reliability depends on data quality, model design, and changing conditions.
3.4 What Is Prescriptive Analytics?
Prescriptive analytics recommends possible actions based on data, objectives, and constraints. It often uses optimisation techniques, simulations, and predictive models to compare different choices.
For example, a delivery company can analyse routes, fuel costs, and delivery times to identify efficient schedules. Consequently, managers can compare options before selecting a suitable plan.
Prescriptive analytics goes beyond predicting what might happen. Instead, it helps decision-makers evaluate what they could do next.
4. How Does the Data Analytics Process Work?
The data analytics process usually involves defining a problem, collecting data, cleaning it, analysing it, presenting insights, and supporting action. Following these steps helps analysts produce useful and reliable results.
Step 1: Define the Business Problem
First, identify the question you want to answer. For example, a company may want to understand why customer retention has decreased.
A clear question helps you choose relevant data and suitable analytical methods.
Step 2: Collect Relevant Data
Next, gather data from suitable sources, such as databases, spreadsheets, websites, surveys, or business applications. However, ensure that you have permission to access and use the information.
Step 3: Clean and Prepare the Data
Data cleaning involves correcting errors, handling missing values, removing duplicates, and standardising formats. In addition, analysts may combine information from multiple sources.
Clean data improves the reliability of later analysis. Nevertheless, analysts should document important changes instead of removing information without a valid reason.
Step 4: Analyse the Data
During analysis, use calculations, queries, statistical methods, and visualisations to answer the original question. For example, you might compare monthly revenue or examine customer purchase patterns.
Furthermore, check unusual results and compare different explanations before drawing conclusions.
Step 5: Visualise and Communicate Insights
Present findings through charts, reports, and dashboards. For instance, a line chart can show sales trends, while a bar chart can compare product performance.
However, avoid overcrowded charts and unnecessary metrics. Instead, highlight the information that matters to your audience.
Step 6: Take Action and Measure Results
Finally, share recommendations with decision-makers and measure what happens after implementation. For example, a company can test a new customer retention strategy and compare results with its previous performance.
Therefore, the analytics process connects data analysis with practical business outcomes.
5. Which Tools Are Used in Data Analytics?
Data analytics tools help professionals collect, clean, analyse, visualise, and communicate data. Beginners can start with spreadsheets and SQL before progressing to Python and business intelligence platforms.
| Tool | Main purpose | Beginner use case |
|---|---|---|
| Microsoft Excel | Spreadsheet calculations and analysis | Sales reports and data summaries |
| SQL | Querying relational databases | Retrieving customer records |
| Python | Data processing and analysis | Analysing datasets with pandas |
| Power BI | Interactive dashboards and reports | Tracking business performance |
| Tableau | Data visualisation and dashboards | Exploring trends visually |
| pandas | Data manipulation in Python | Cleaning and summarising data |
| NumPy | Numerical computing | Working with numerical arrays |
| Matplotlib | Data visualisation | Creating charts and graphs |
Which Data Analytics Tool Should Beginners Learn First?
Beginners should learn Excel, SQL, and basic data visualisation before adding advanced tools. This sequence builds a practical foundation for working with real business data.
First, practise spreadsheet formulas, sorting, filtering, and pivot tables. Next, learn SQL queries, including SELECT, WHERE, GROUP BY, and JOIN.
After that, explore Power BI or Tableau to create dashboards. Finally, learn Python and pandas when you feel comfortable handling data.
However, you do not need to master every tool at once. Choose tools that match your goals and practise them through small projects.
Mid-Article CTA: Learn Practical Data Analytics with Infycle Technologies
Want to develop data analytics skills for your career? Infycle Technologies in Chennai is an option to explore if you prefer guided technical learning and practical exercises.
A useful training plan should cover Excel, SQL, Python, data cleaning, statistics, visualisation, and dashboard development. Furthermore, practical projects can help you apply these skills to business problems.
If you are considering Data Analytics Training in Chennai, enquire about the current syllabus, trainer experience, project work, batch timings, and demo classes before enrolling.
Visit: https://www.infycletechnologies.com/
6. What Are the Applications of Data Analytics?
Data analytics helps organisations understand performance, identify patterns, and make informed decisions across many industries. Its applications range from tracking sales to improving healthcare services.
Retail and E-Commerce
Retailers analyse customer purchases, product performance, and seasonal demand. As a result, they can plan inventory, evaluate promotions, and understand buying behaviour.
Banking and Finance
Financial organisations use analytics to examine transactions, assess risks, and monitor performance. In addition, analytical systems can help flag unusual transaction patterns for further investigation.
Healthcare
Healthcare organisations analyse operational data, patient records, and resource usage. Consequently, they can identify service trends and support planning, subject to privacy rules and appropriate clinical oversight.
Education
Educational institutions can examine attendance, assessment results, and enrolment trends. Therefore, educators may identify learning gaps and plan suitable support.
Marketing
Marketing teams analyse website traffic, campaign results, and customer engagement. Furthermore, they can compare campaigns to understand which channels contribute to business goals.
Manufacturing
Manufacturers use analytics to track production output, quality issues, and equipment performance. In some settings, predictive analysis can also help teams plan maintenance.
Transportation and Logistics
Transport companies analyse routes, delivery times, and fuel usage. As a result, they can identify delays and improve operational planning.
7. What Is the Difference Between Data Analytics and Data Science?
Data analytics focuses on examining data to answer questions and support decisions, while data science covers a broader range of activities, including advanced modelling and machine learning. However, the two fields overlap in tools and methods.
| Factor | Data Analytics | Data Science |
|---|---|---|
| Main focus | Understanding data and business performance | Developing data-driven methods and models |
| Common tasks | Reporting, querying, visualisation, and analysis | Analysis, experimentation, modelling, and machine learning |
| Common tools | Excel, SQL, Power BI, Tableau | Python, SQL, statistics, machine learning libraries |
| Typical output | Reports, dashboards, and insights | Analytical solutions, predictive models, and research |
| Beginner starting point | Excel, SQL, and visualisation | Python, statistics, and data analysis |
For example, a data analyst may use sales records to explain why revenue declined. Meanwhile, a data scientist may build a model to estimate future demand.
Nevertheless, job responsibilities vary across companies. Therefore, review individual job descriptions instead of assuming every role follows the same pattern.
8. What Skills Do Beginners Need for Data Analytics?
Beginners need data-handling skills, basic statistics, analytical thinking, and communication skills to work effectively with data. Fortunately, you can develop these abilities gradually through practice.
Important skills include:
- Excel: Learn formulas, filtering, pivot tables, and charts.
- SQL: Practise retrieving, joining, and summarising database records.
- Statistics: Understand averages, percentages, distributions, and correlation.
- Data cleaning: Learn to identify missing values, duplicates, and inconsistent formats.
- Visualisation: Present trends through clear charts and dashboards.
- Python: Use libraries such as pandas for data manipulation.
- Communication: Explain findings and recommendations in simple language.
- Problem-solving: Connect analytical results to real business questions.
Furthermore, build projects that combine several skills. For example, analyse a retail sales dataset, create a dashboard, and write a short report explaining your findings.
9. How Can You Learn Data Analytics as a Beginner?
You can learn data analytics by following a structured path from spreadsheets and SQL to visualisation and practical projects. Consistent practice is more useful than trying to learn every tool simultaneously.
Follow this beginner-friendly roadmap:
| Stage | Learning focus | Practice activity |
|---|---|---|
| 1 | Excel fundamentals | Create a sales summary |
| 2 | SQL basics | Query a sample database |
| 3 | Statistics | Calculate averages and percentages |
| 4 | Data cleaning | Prepare a messy spreadsheet |
| 5 | Power BI or Tableau | Build an interactive dashboard |
| 6 | Python and pandas | Explore a CSV dataset |
| 7 | Portfolio projects | Document your findings and recommendations |
First, work with small datasets that you can understand. Next, practise asking questions and finding answers through calculations and charts.
After that, build two or three projects using publicly available or appropriately anonymised data. Finally, document your methods, findings, and limitations in a portfolio.
Which Projects Can Help Beginners Practise Data Analytics?
Beginner projects help you demonstrate your ability to turn raw data into useful insights. Therefore, choose projects with clear questions and measurable outcomes.
Consider these ideas:
- Sales analysis: Identify top-selling products and monthly trends.
- Customer analysis: Examine purchasing patterns and customer segments.
- Student performance analysis: Explore attendance and assessment results.
- Marketing campaign analysis: Compare traffic, engagement, and conversions.
- HR analytics: Examine employee turnover patterns using suitable anonymised data.
For each project, explain the business question, data source, cleaning steps, analysis, and recommendations. Moreover, avoid presenting correlations as proven causes without further evidence.
10. Self-Learning vs. Structured Data Analytics Training: Which Is Better?
Self-learning provides flexibility, while structured training can offer a planned syllabus and guided practice. The best option depends on your budget, schedule, learning style, and career goals.
| Factor | Self-learning | Structured training |
|---|---|---|
| Schedule | Flexible | Usually follows batch timings |
| Cost | Can be free or low-cost | Usually involves a course fee |
| Learning path | You create your own plan | A syllabus guides your progress |
| Doubt clarification | Depends on available resources | Trainer support may be available |
| Projects | Self-managed | May include guided projects |
| Interview preparation | Requires independent practice | May include mock interviews |
| Best suited for | Independent learners | Learners who prefer guidance |
However, neither option guarantees employment. Your results also depend on practical experience, project quality, communication skills, and interview preparation.
If you are comparing a Data Analytics Course in Chennai, review its syllabus, practical sessions, tools, and project support. Similarly, evaluate each Best Software Training Institute in Chennai candidate using clear criteria rather than promotional claims alone.
11. Frequently Asked Questions About Data Analytics
What Is Data Analytics in Simple Words?
Data analytics means examining data to find useful information and answer questions. For example, a business can analyse sales records to identify popular products. Therefore, data analytics helps people understand what happened, discover patterns, and make better-informed decisions.
What Are the Four Types of Data Analytics?
The four main types are descriptive, diagnostic, predictive, and prescriptive analytics. Descriptive analytics explains what happened, while diagnostic analytics investigates why. Predictive analytics estimates what may happen next. Finally, prescriptive analytics helps evaluate possible actions based on data and objectives.
Is Data Analytics Easy for Beginners?
Data analytics is accessible to beginners who learn step by step. Start with Excel, basic statistics, and SQL. Next, practise cleaning data and creating charts. Furthermore, build small projects regularly to improve your problem-solving skills and confidence.
Can I Learn Data Analytics Without Coding?
Yes, you can begin data analytics without coding by using Excel and business intelligence tools. However, SQL is valuable for working with databases, while Python can support more advanced analysis. Therefore, learning basic coding can expand your options as your skills grow.
What Jobs Can I Explore After Learning Data Analytics?
You can explore entry-level roles such as junior data analyst, reporting analyst, MIS executive, and business intelligence analyst, depending on your skills and the employer’s requirements. Furthermore, a strong portfolio and practical knowledge can help demonstrate your abilities during recruitment.
Conclusion
Data analytics transforms raw data into useful insights that help people understand problems, track performance, and make informed decisions. Its four main types—descriptive, diagnostic, predictive, and prescriptive analytics—serve different purposes across business and industry.
Furthermore, beginners can build a strong foundation by learning Excel, SQL, statistics, data visualisation, and Python. Practical projects can help you apply these skills and demonstrate your analytical thinking to potential employers.
If you want structured guidance, consider Data Analytics Training in Chennai at Infycle Technologies. Before enrolling, compare the syllabus, practical exercises, trainer support, and available demo classes.
Remember, progress comes from consistent practice and curiosity. Therefore, start with the fundamentals, work with real datasets, and gradually build a portfolio that demonstrates what you can do.