Top Data Analytics Tools Empowering Decision Making
Introduction
Data Analytics Tools help businesses convert raw information into useful insights and better decisions. In Chennai, students, fresh graduates, and career changers can build valuable analytics skills by learning practical tools.
However, choosing the right tools can feel difficult for beginners. Therefore, understanding what each platform does can help you select the right learning path.
From spreadsheets and SQL to Power BI, Tableau, and Python, analytics offers many options. Moreover, each tool serves a different purpose across data collection, cleaning, visualization, reporting, and analysis.
Table of Contents
- What is Data Analytics Tools?
- Why Choose a Data Analytics Tools in Chennai?
- Key Modules Covered in a Data Analytics Tools
- Practical Tools You Master in Data Analytics Tools Training
- Career Opportunities After Completing a Data Analytics Tools
- Self-Learning vs. Hands-on Training at Infycle Technologies
- Frequently Asked Questions About Data Analytics Tools
- Conclusion
- Final CTA
What is Data Analytics Tools?
Data Analytics Tools are software platforms that help users collect, process, analyze, visualize, and interpret data. Simply put, these tools turn complex datasets into information that people can understand.
For example, Microsoft Excel supports calculations, reporting, and basic data analysis. Furthermore, SQL helps analysts retrieve information from relational databases.
Python provides another powerful option for advanced analysis and automation. In addition, libraries such as Pandas and NumPy support data manipulation and numerical analysis.
Visualization platforms also play an important role in analytics. Therefore, tools such as Power BI and Tableau help users create interactive dashboards and communicate findings.
The best tool depends on the business requirement, dataset size, technical skills, and reporting needs. However, learning several complementary tools can make an analyst more flexible.
Why Choose a Data Analytics Tools in Chennai?
Learning Data Analytics Tools in Chennai can help learners develop practical skills for modern analytics roles. However, tool knowledge becomes more valuable when learners understand how to apply it to business problems.
Chennai offers opportunities across IT services, banking, healthcare, retail, manufacturing, e-commerce, and finance. As a result, analytics skills can support career paths across multiple industries.
Furthermore, learners from Arts, Science, Commerce, and Engineering backgrounds can enter the analytics field. A structured approach can help beginners develop confidence without becoming overwhelmed by technical concepts.
A quality Data Analytics Training in Chennai should include practical assignments and real-world datasets. In addition, learners should receive opportunities to create dashboards and solve business-oriented problems.
Key Modules Covered in a Data Analytics Tools
A strong analytics learning plan should cover data preparation, database querying, visualization, reporting, and analytical thinking. Therefore, learners should study tools according to their practical use.
Excel for Data Analysis
Excel remains useful for everyday data analysis and reporting. For instance, analysts can use formulas, pivot tables, charts, filters, and conditional formatting to examine datasets.
Power Query can also help users import and transform information. Moreover, Excel provides a useful starting point for beginners before they move into advanced platforms.
SQL for Database Analysis
SQL helps analysts retrieve and organize information from databases. In simple terms, it allows users to ask questions from structured data.
Learners should practice SELECT queries, filtering, joins, grouping, subqueries, and aggregate functions. Furthermore, SQL skills can support many entry-level data analyst roles.
Power BI for Business Intelligence
Power BI helps users create interactive dashboards and business reports. Therefore, learners can use it to track sales, customers, expenses, performance, and other important metrics.
Power Query supports data transformation before visualization. In addition, DAX helps users create calculations and analytical measures.
Tableau for Data Visualization
Tableau focuses strongly on visual analytics and dashboard development. For example, users can create charts, maps, filters, and interactive dashboards.
Furthermore, Tableau can help teams explore trends and identify patterns quickly. Its visual interface also makes data exploration accessible to users with different technical backgrounds.
Python for Advanced Analytics
Python supports advanced data analysis, automation, and machine learning. Therefore, learners can use Pandas for data manipulation and NumPy for numerical operations.
Matplotlib and Seaborn support visualization tasks. In addition, Scikit-learn provides algorithms for machine learning and predictive analysis.
Data Cleaning and Preparation
Data cleaning is essential because raw datasets often contain missing or inconsistent information. As a result, analysts must prepare data before creating reliable reports.
Learners should practice removing duplicates, handling missing values, correcting formats, and validating datasets. Moreover, clean data helps improve the accuracy of analytical results.
Statistical Analysis
Statistics helps analysts understand trends, relationships, and variations within datasets. For instance, learners should understand averages, percentages, distributions, correlation, and basic probability.
These concepts support better interpretation of analytical findings. Therefore, statistics should remain an important part of analytics training.
Practical Tools You Master in Data Analytics Tools Training
Practical experience helps learners understand how analytics tools work in real situations. Moreover, consistent practice can improve both technical confidence and problem-solving ability.
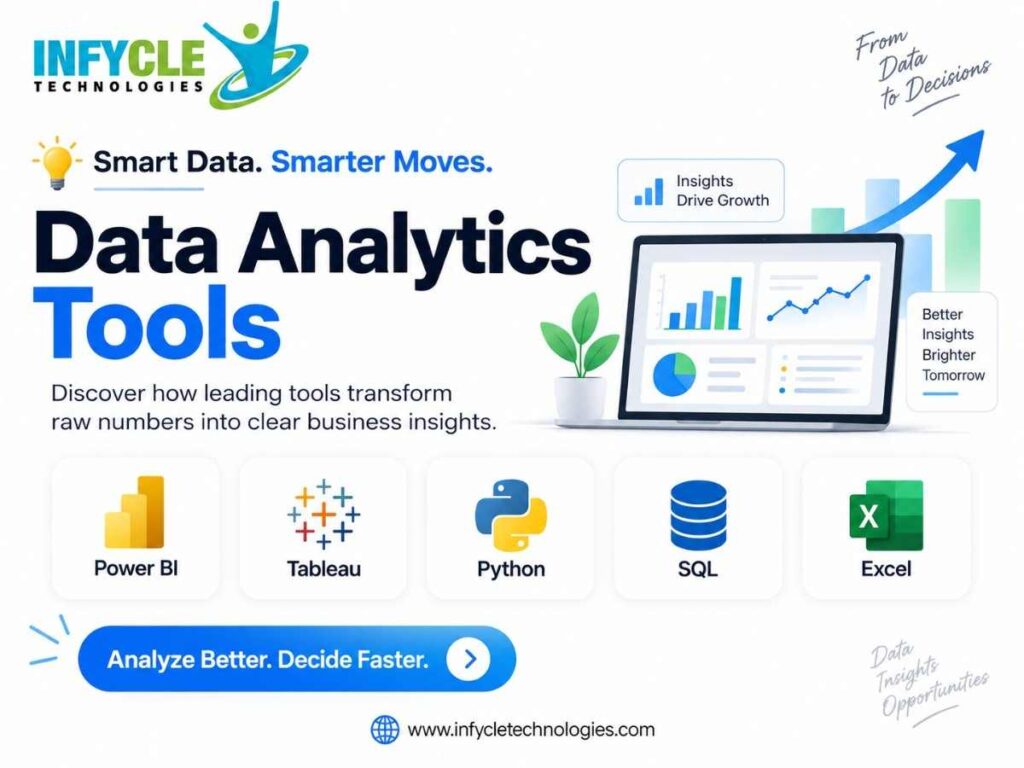
Learners should practice Excel, SQL, Power BI, Tableau, and Python based on their career goals. Furthermore, working with real datasets can teach them how to handle common data problems.
For example, a learner could analyze monthly sales data using Excel and SQL. Next, the same dataset could become a Power BI dashboard for management reporting.
Python can then support deeper analysis when the dataset becomes larger or more complex. Therefore, combining tools creates a more complete analytics workflow.
Git and GitHub can also support project documentation and portfolio development. In addition, learners can showcase selected dashboards, SQL projects, and analytical case studies.
Career Opportunities After Completing a Data Analytics Tools
Learning analytics platforms can prepare candidates for several entry-level and advanced data roles. However, career growth depends on practical ability, communication, projects, and industry knowledge.
Common roles include Data Analyst, Business Analyst, Reporting Analyst, BI Analyst, and Junior Data Analyst. Furthermore, experienced professionals can progress toward senior analytics and business intelligence positions.
Employers often value candidates who can explain their findings clearly. Therefore, communication skills should develop alongside technical skills.
A portfolio can also strengthen a candidate’s job application. For instance, candidates can showcase sales dashboards, customer analysis, financial reports, or operational analytics projects.
For learners planning a career transition, choosing a practical Data Analytics Course in Chennai can provide structured learning and project exposure. In addition, guided training can help learners understand which tools matter for their target roles.
Self-Learning vs. Hands-on Training at Infycle Technologies
Self-learning offers flexibility, while hands-on training provides structure and guided practice. Therefore, learners should consider their schedule, learning style, and career objectives.
| Factor | Self-Learning | Hands-on Training at Infycle Technologies |
|---|---|---|
| Learning structure | Self-managed | Guided learning path |
| Tool practice | Learner-managed | Practical sessions |
| Doubt clarification | Online resources | Trainer support |
| Projects | Self-selected | Guided projects |
| Portfolio | Self-managed | Project guidance |
| Interview preparation | Self-managed | Career-focused support |
| Learning consistency | Requires discipline | Regular practice |
Self-learning can work well for highly independent learners. However, beginners may spend extra time choosing resources and understanding what to study next.
Hands-on training can provide a clearer progression from fundamentals to projects. Furthermore, practical assignments allow learners to apply concepts instead of only reading about them.
Want to turn theory into practical analytics skills? Data Analytics Tools training at Infycle Technologies can help you practice Excel, SQL, Power BI, Tableau, Python, and real-world datasets through structured learning.
Build practical knowledge, create useful projects, and prepare for your next analytics career step in Chennai.
Frequently Asked Questions About Data Analytics Tools
What are the most useful Data Analytics Tools for beginners?
Excel, SQL, and Power BI are strong starting points for beginners. Furthermore, Python can be added when learners are ready for advanced analysis.
Do I need programming knowledge to learn analytics tools?
No, beginners can start analytics without advanced programming knowledge. However, learning SQL and basic Python can expand your career opportunities.
Which tool should I learn first for a data analyst career?
Excel and SQL provide a practical foundation for many entry-level analytics roles. Next, learners can add Power BI, statistics, and Python based on their career goals.
Can Data Analytics Tools help with career growth?
Yes, practical tool knowledge can support careers in data analysis, business intelligence, and reporting. Therefore, learners should combine tool skills with projects and communication abilities.
Conclusion
Modern analytics depends on the right combination of tools, analytical thinking, and practical experience. Excel provides a familiar starting point, while SQL supports database analysis and reporting.
Furthermore, Power BI and Tableau make complex information easier to understand through interactive visualizations. Python adds flexibility for advanced analysis, automation, and machine learning.
For students and job seekers, the right Data Analytics Course in Chennai can provide structured learning and practical exposure. Most importantly, focus on solving real business problems rather than simply learning software features.
Final CTA
Ready to build practical analytics skills?
Connect with Infycle Technologies in Chennai for free career counseling and a live demo. Get guidance on the right learning path, practical projects, and the skills needed to move toward your analytics career.