What Are The 7 V’s Of Big Data?
With rapid data growth, the use of paper documents, files, and storage devices has become useless. People have begun to store data in computerized databases; however, even with the expansion of the internet, modern apps, and methods, the capacity for storage is inadequate.
The concept of big data goes beyond just storing large amounts of data. Big Data is one such sort of data that comes from multiple sources and comprises different kinds of data in various forms. It is tough to characterize because of its vastness and variety. That is why professionals keep building and describing more V’s. They are different dimensions of Big Data. Each V gives us additional knowledge about exactly what Big Data is.
If you wish to pursue a profession in big data, you must be familiar with these V’s in big data. With the help of Big data training in Chennai, you can learn each V in detail.
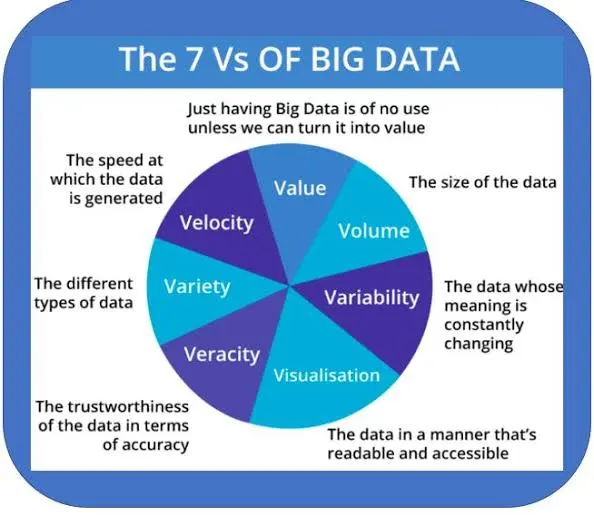
There have been many Vs described already, but the first seven are typically the same. They are Volume, Variety, Velocity, Variability, Veracity, Visualization, and Value. Read on to learn more about the Seven V’s of Big Data.
Volume
The primary distinguishing characteristic of big data is its massive volumes of data. The term volume defines “BIG” data in this case. With the enormous quantity of data produced every day, we all know that a few gigabytes are inadequate to store such massive amounts of data. The size of data has therefore been redefined as Zettabytes, Exabytes, and Yottabytes instead of megabytes.
The term “volume of data” refers to the total number of data sets that should be analyzed and processed. As data sets grow in size and complexity, they now regularly exceed terabytes and petabytes. Because of the sheer amount of data, it is necessary to create new processing methods that are different from those used for regular data storage and analysis.
Velocity
Velocity is another of the 7 Vs of Big Data. This simply refers to how quickly data can be processed and made available. The velocity at which data is transferred, analyzed, and collected both within and outside of business has expanded dramatically in recent years. People excel at “generating” data, but what about analyzing it? It’s all real-time now, isn’t it? Yes, But analyzing these Zettabytes of data requires a growing amount of computing power.
In the scenario of social media posts, YouTube videos, audio recordings, podcasts, and images, which are uploaded several hundred times per second, the data should be accessible as fast as possible. Data may be shared in near real-time due to the accessibility and prevalence of devices linked to the internet, either wirelessly or via wired connections. Currently, information is being transmitted at terrifying speeds.
Variety
Data usually originates from a variety of sources. Variety refers to the range of data sources as well as data types. The form, origin, and format of data can differ according to the source, and the data may be structured or unstructured. In order to extract beneficial insights from big data, it is essential to comprehend the many types of data, where they came from, and how they relate across datasets.
At times, Companies used to get the majority of their understanding from organized data that could be stored in their own databases, like Microsoft Excel. In the modern world, you are also dealing with unstructured data that is difficult to handle and arrives in a variety of formats, including emails, client feedback, SMS, social network posts, sensor readings, audio, photos, and video. Companies find it difficult to analyze, ingest, and assess this kind of data in real time.
Veracity
Veracity is undoubtedly the most crucial of the five Vs since it provides the foundation for business achievement. Only complete and accurate data can generate corporate profit and impact change.
The veracity of data refers to its accuracy and credibility. Data must be validated to verify that it truly reflects critical business operations and that any data processing, modeling, or evaluation has no impact on the data’s accuracy. This is also the reliability or integrity of the data that a business receives and processes in order to draw relevant insights.
Veracity varies from one organization to another. The veracity of a data source will depend on its track record. If the source is unknown or has a less than enviable record, its veracity will be low. For instance, businesses may discover that there is a strong correlation between buying a particular product and enrolling in additional training programs. Marketing campaigns for training programs can be based on a list of customers who bought that product. If the ultimate objective of your big data analysis is to improve the training program business, that particular consumer list would be regarded as highly reliable.
Variability
Variability describes data whose significance changes on a regular basis. This is especially true when data collection depends on language analysis. Variability differs from variety. Understanding and correctly interpreting the significance of unprocessed data are the key areas of variation.
For instance, An ice cream shop may offer six different flavors of ice cream, but if you get the same flavor every day, it will taste different every time that’s variability. In the same way, if your data is constantly changing, it might affect the overall quality of your data. To assure data quality, data cleaning, and validation steps are often used to handle this variability.
Visualization
Data visualization is essential for data analytics since it involves displaying the analyzed data in a way that is understandable to a visual audience. In today’s world, visualization is essential. Large volumes of complex data can be visualized using graphical representations far more effectively than using reports and Excel sheets that are filled with figures and calculations.
Raw data must be presented in a suitable way in order to be used and leveraged. Numerous forms, such as Word documents, Excel files, graphs, and others, can be used to present data. Data visualization is vital for making the information understandable, accessible, and easy to access, regardless of its format.
Value
The potential value of Big Data is huge. There is no denying that people who can manage Big Data’s size and uncover its knowledge can gain a great deal from it. Big Data provides not just fresh, more efficient ways to market things but also important clues for brand-new items to satisfy unexpected customer requirements.
In an effort to save money for both their businesses and their clients, many sectors are turning to big data. Although indirectly, those that provide equipment and techniques for handling Big Data, its evaluation, and visualization have also benefited tremendously.
Why Should You Know All These 7 Vs?
Companies find big data to be highly helpful. If you are a fresher or an experienced professional looking to establish a career in big data, understanding all seven V’s will give you a competitive advantage over others. You can read about How To Start A Career In Big Data As A Fresher to learn about the career opportunities in Big Data.
Where Can I Learn More About Big Data?
The technical skills necessary for careers in big data frequently require training and practical experience. There are numerous software training institutes, such as Infycle, that may assist you in learning Big Data. There are also various learning tools, such as audio podcasts, books, blogs, and YouTube tutorials, that can help you expand your skill set and showcase your expertise in the field of Big data to potential employers.
Conclusion
These big data components go beyond simple academic research. For businesses to process their data effectively, it’s essential to be aware of these variables. The 7 Vs can help you, specifically, locate the appropriate tools to alter your data, create operations based on this new data, and establish rules to ensure data reliability. This makes sure your big data accomplishes your goals by giving you the statistical analysis and business insight you require to make lucrative, smart choices.